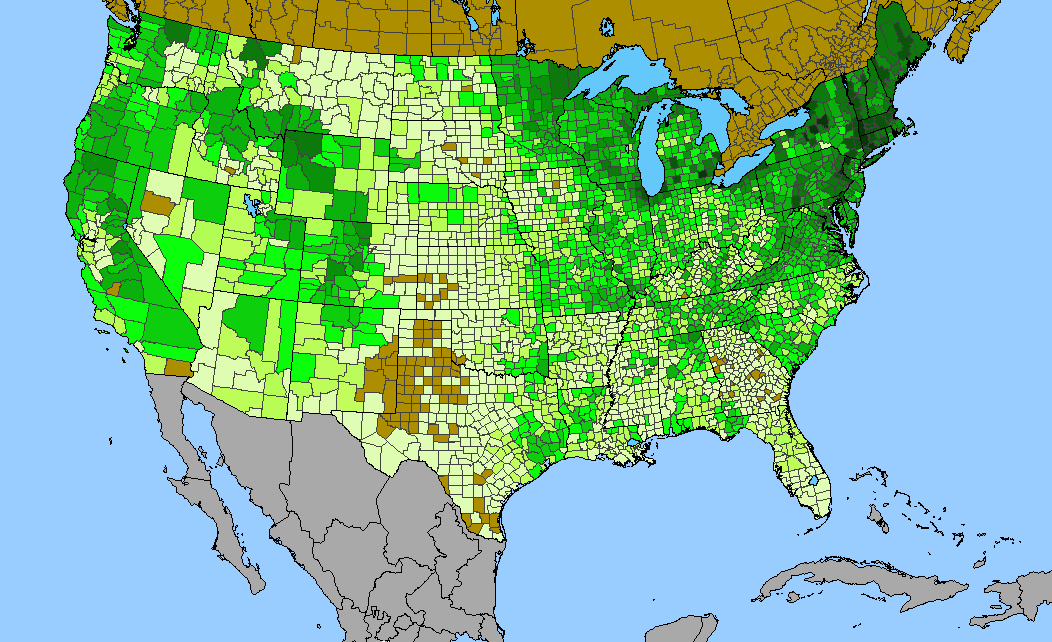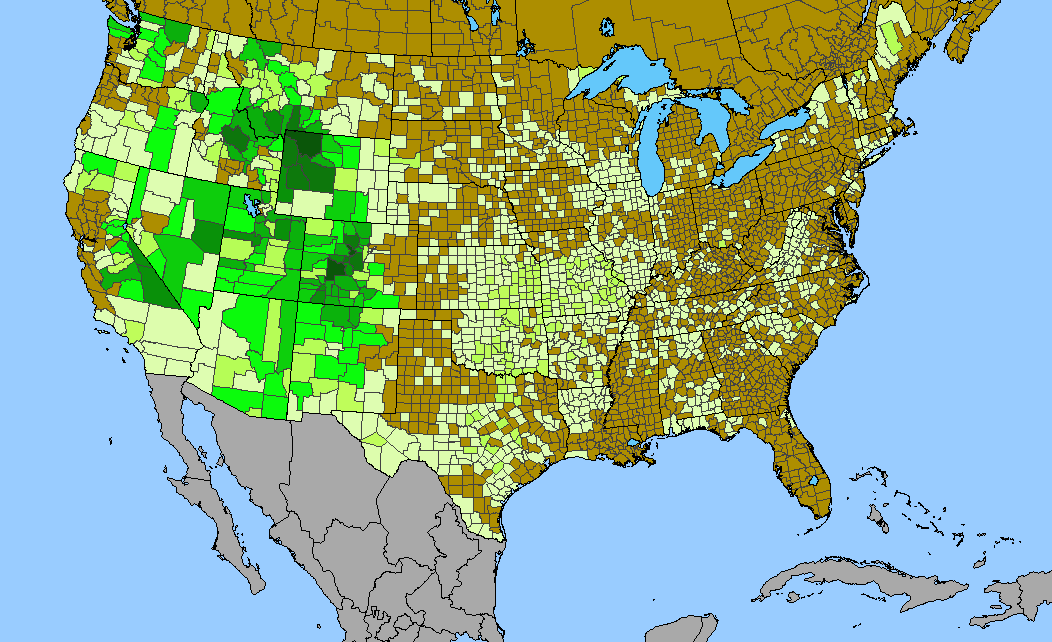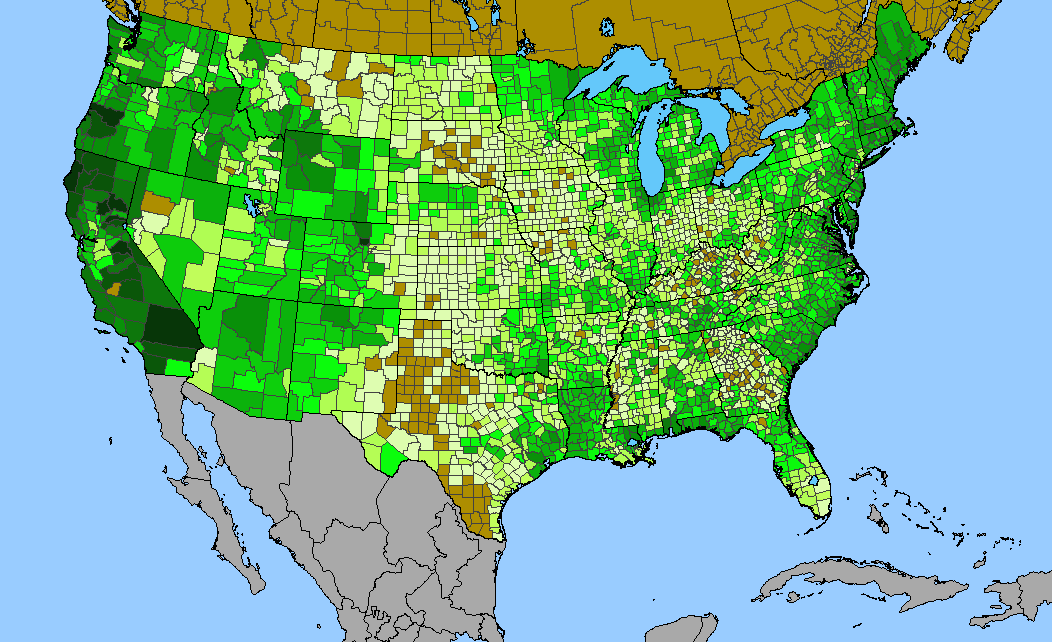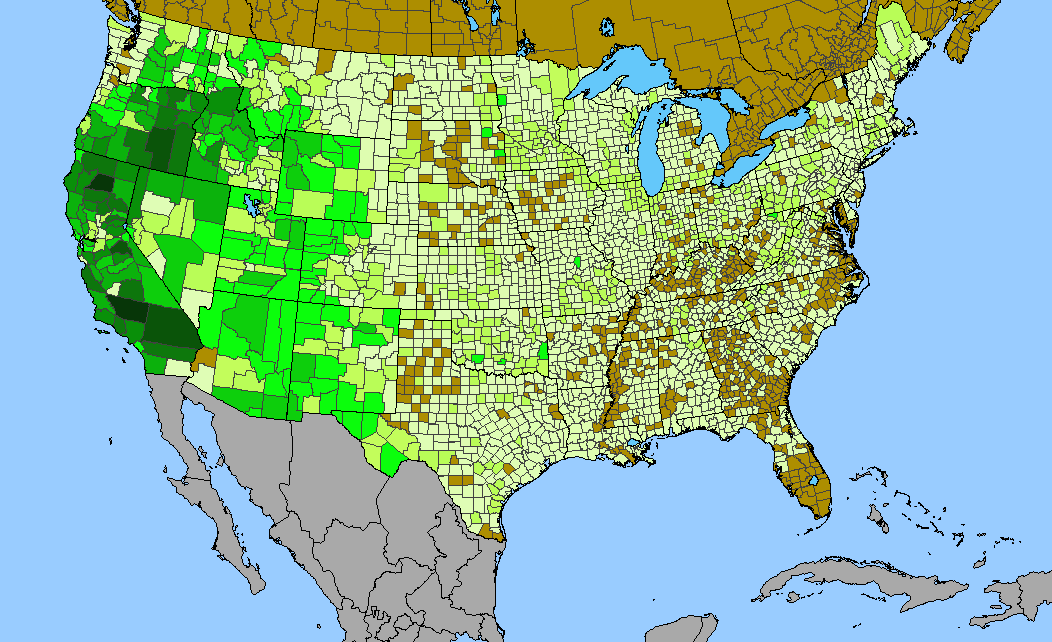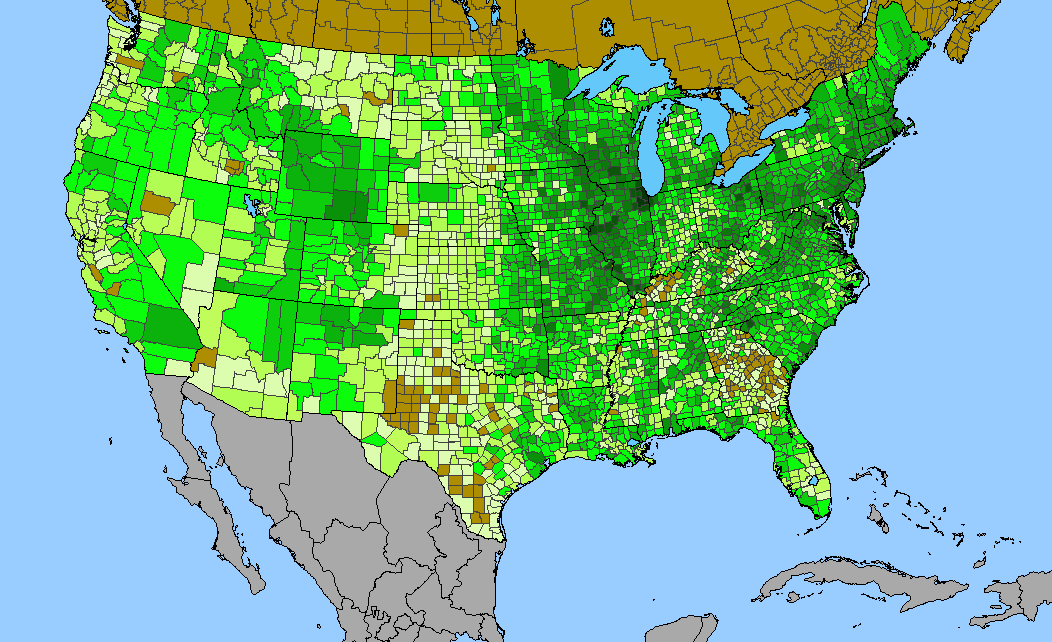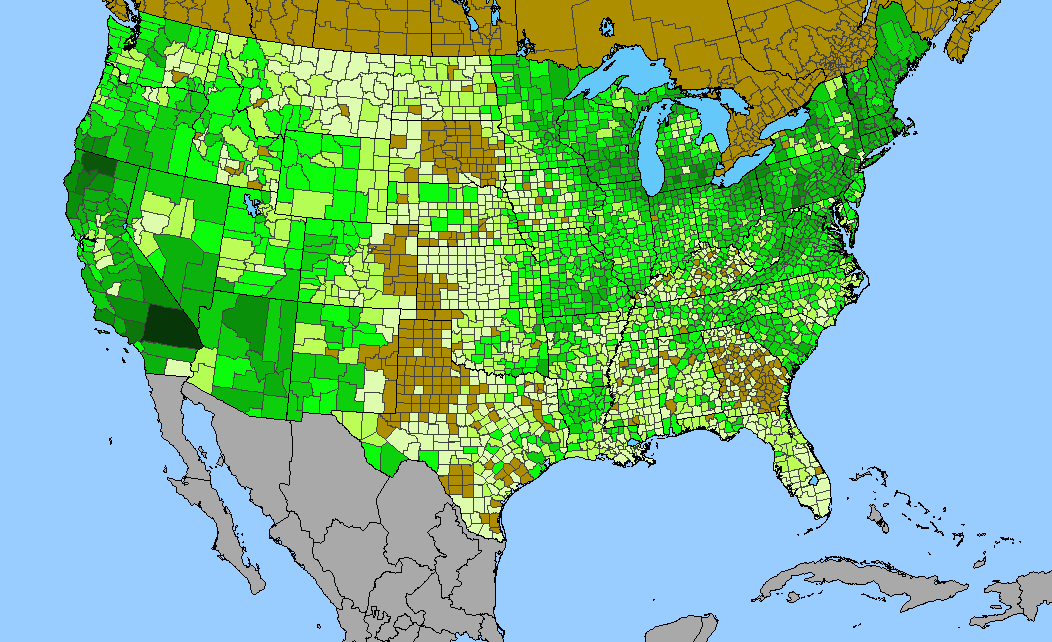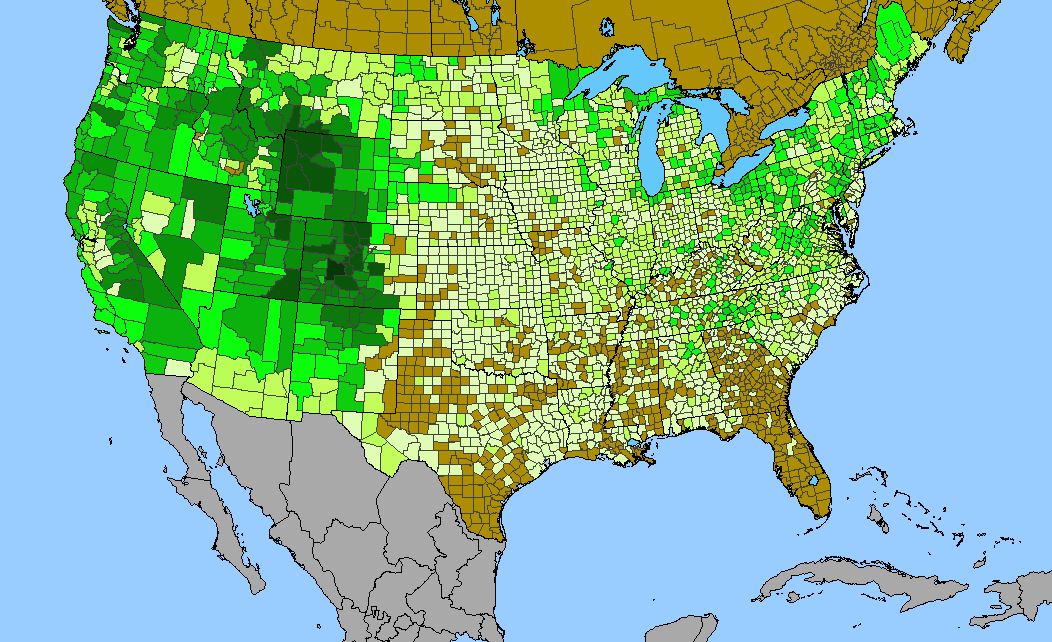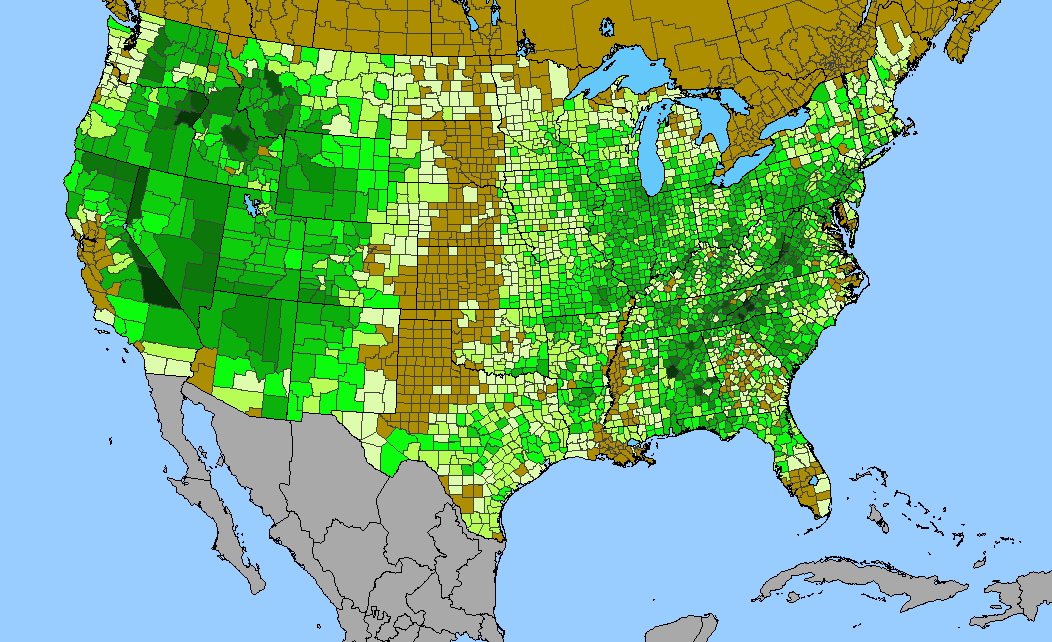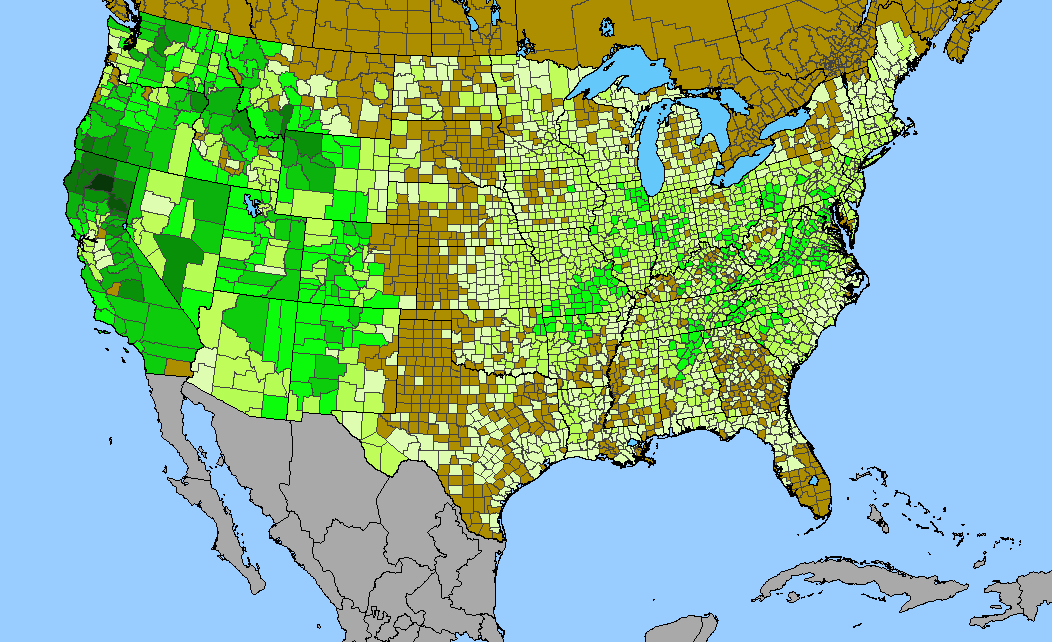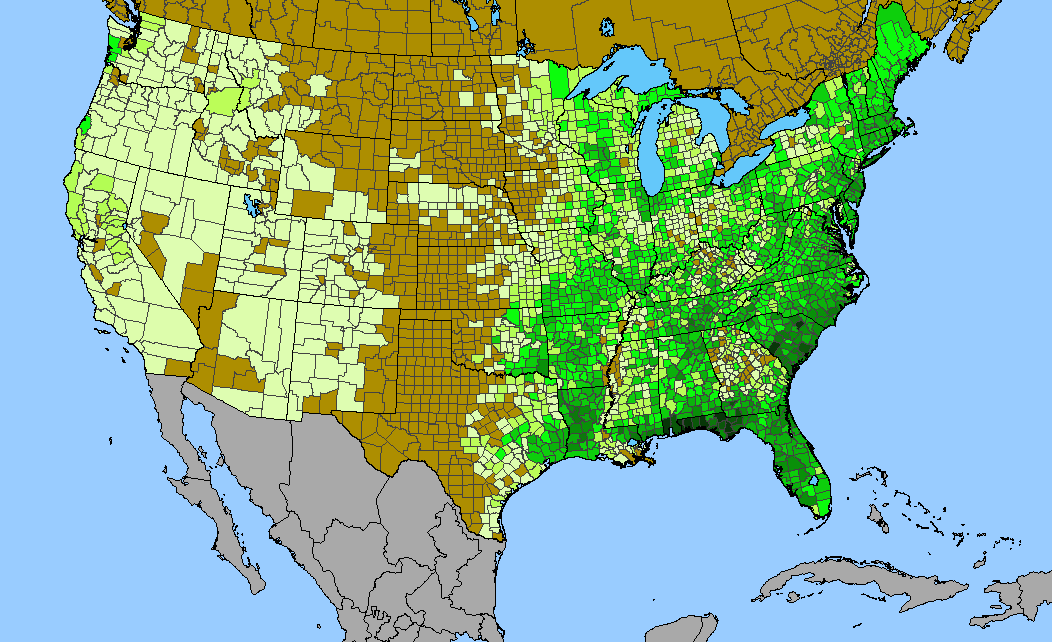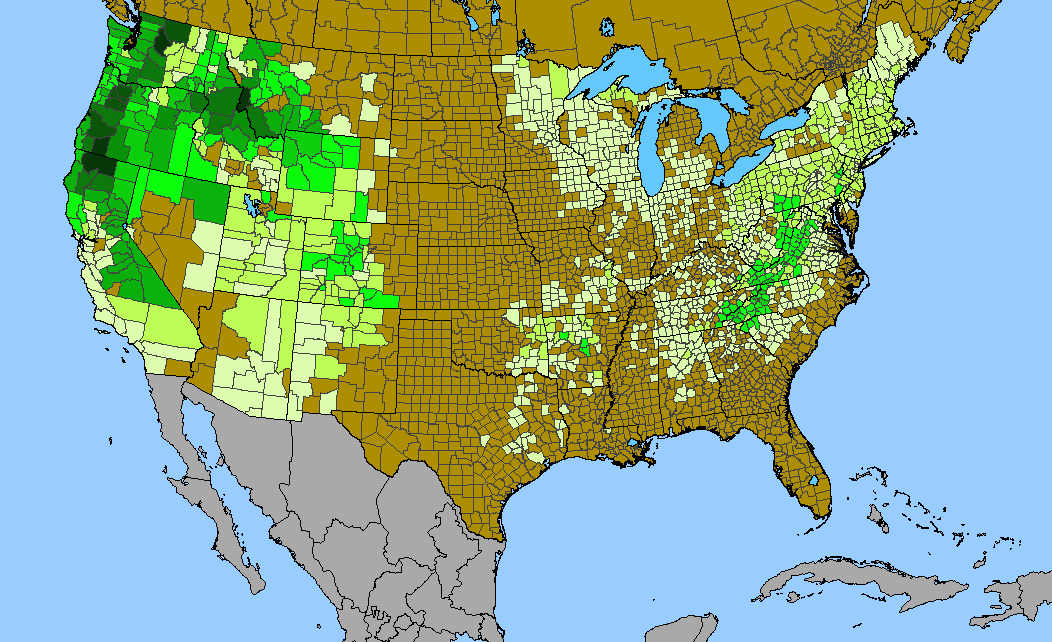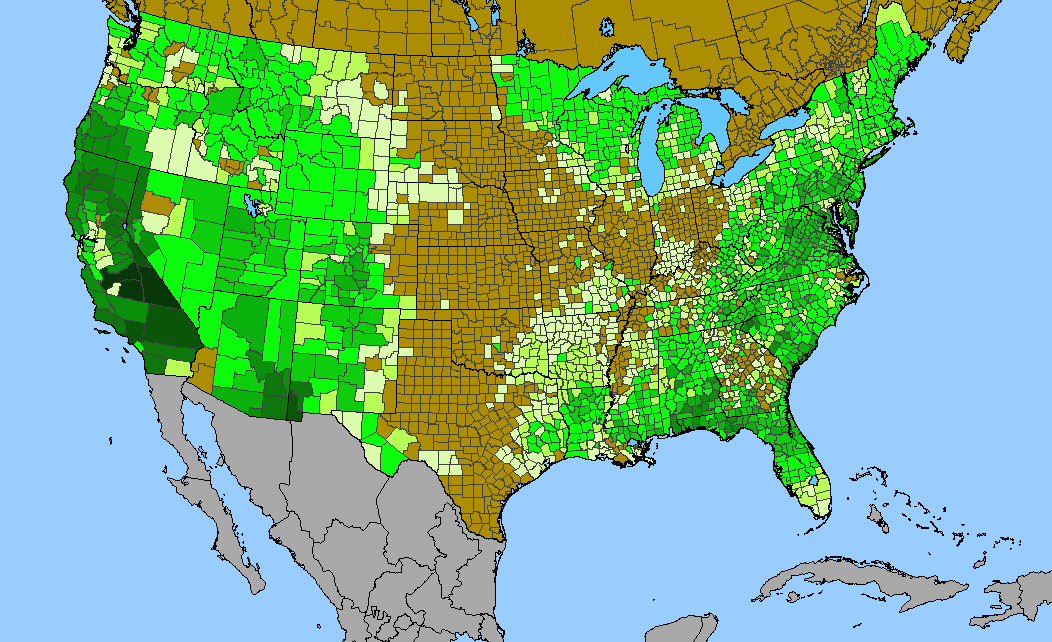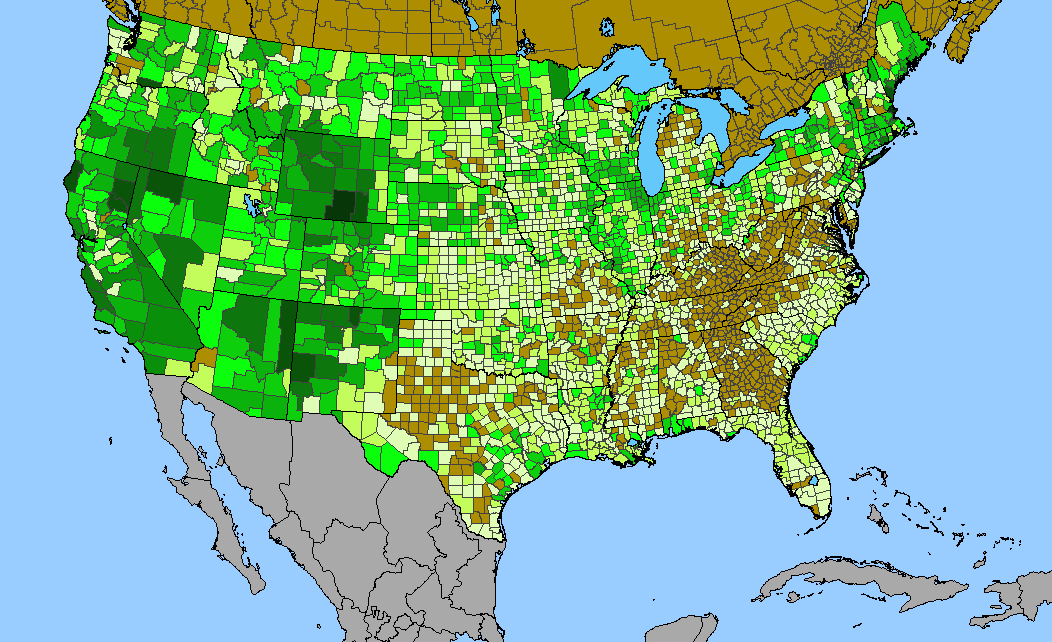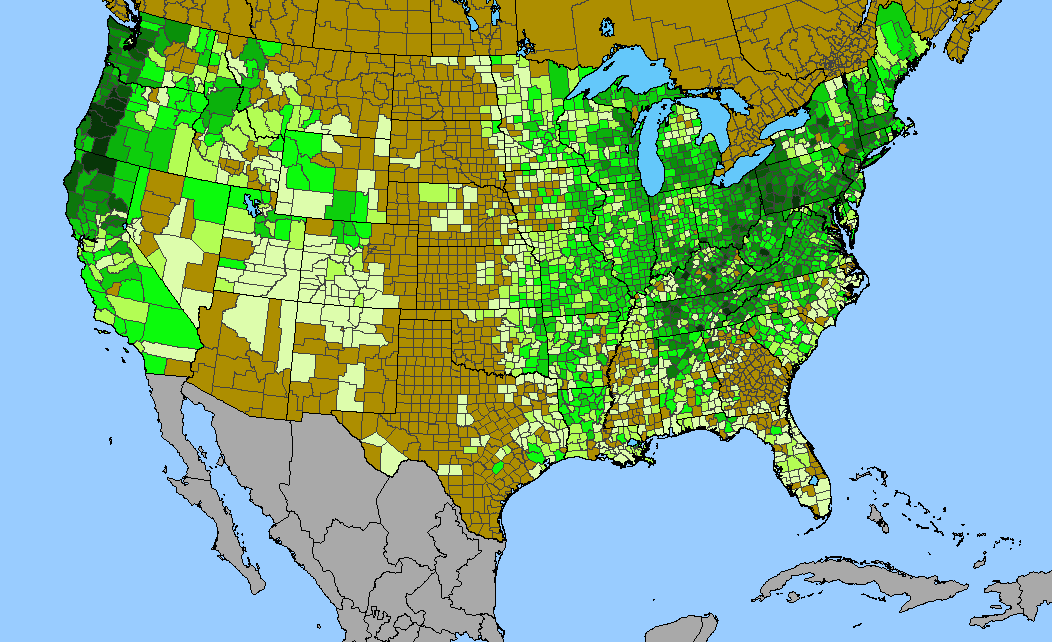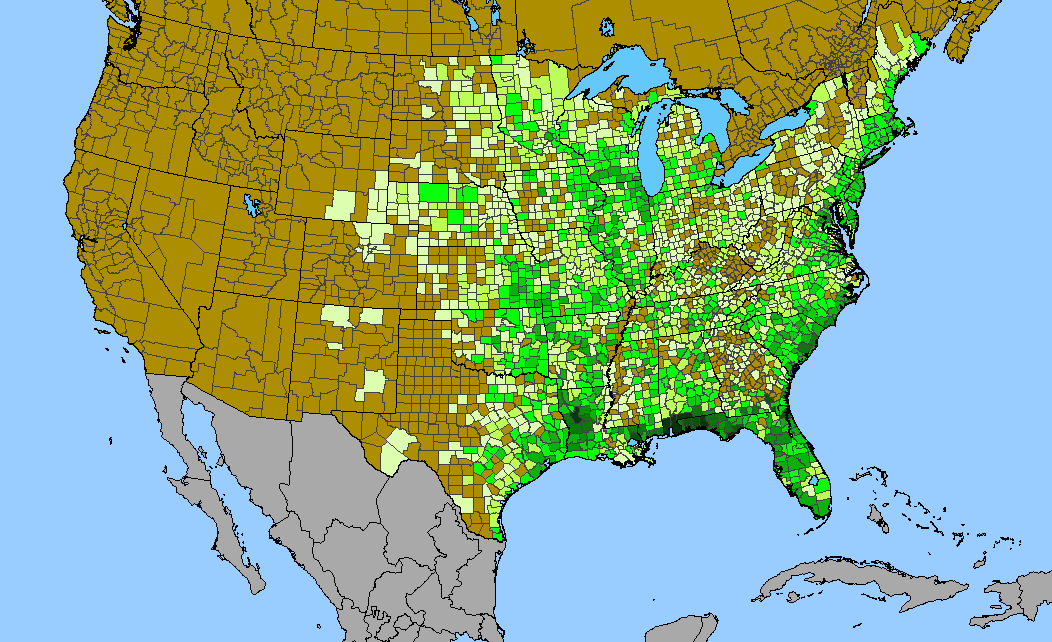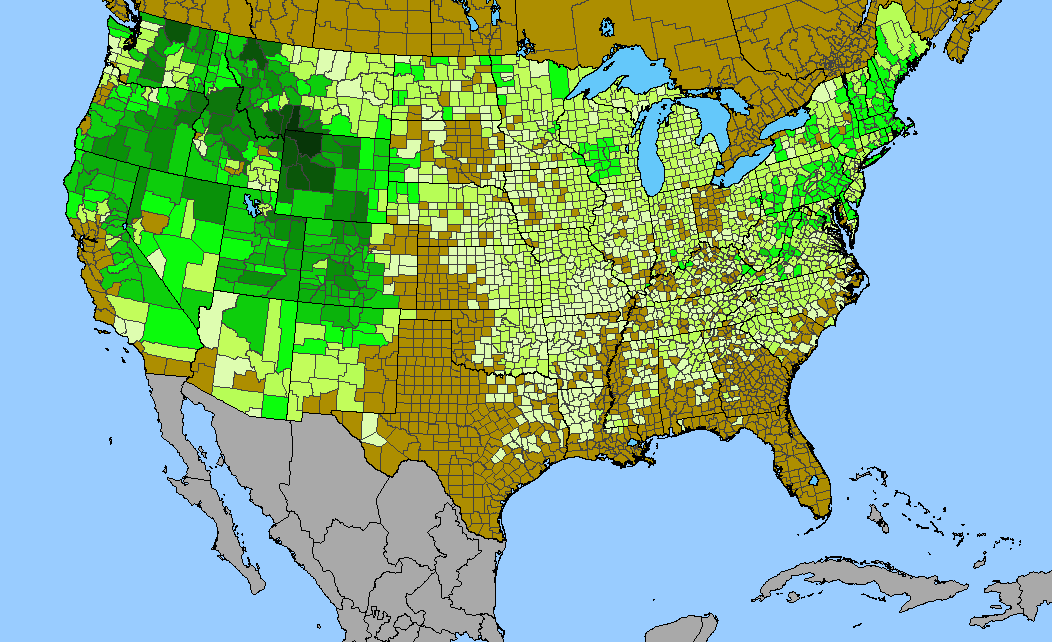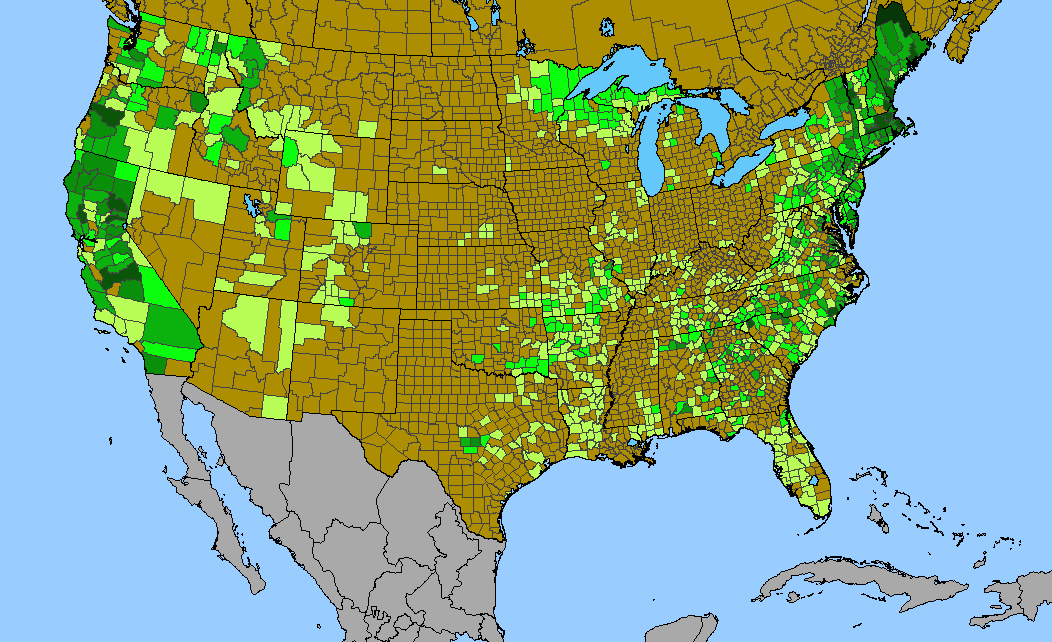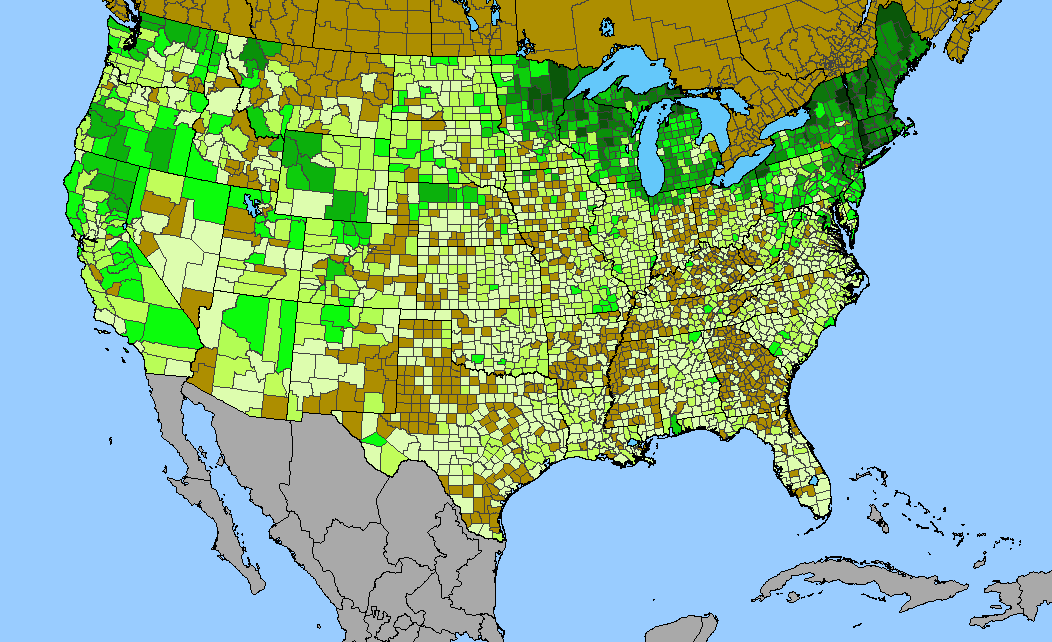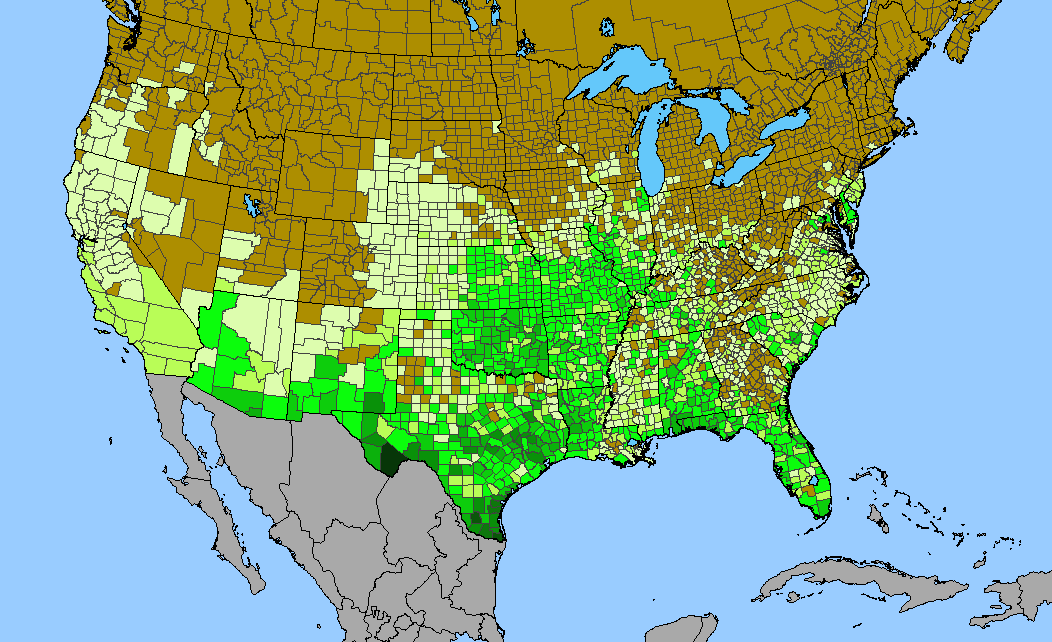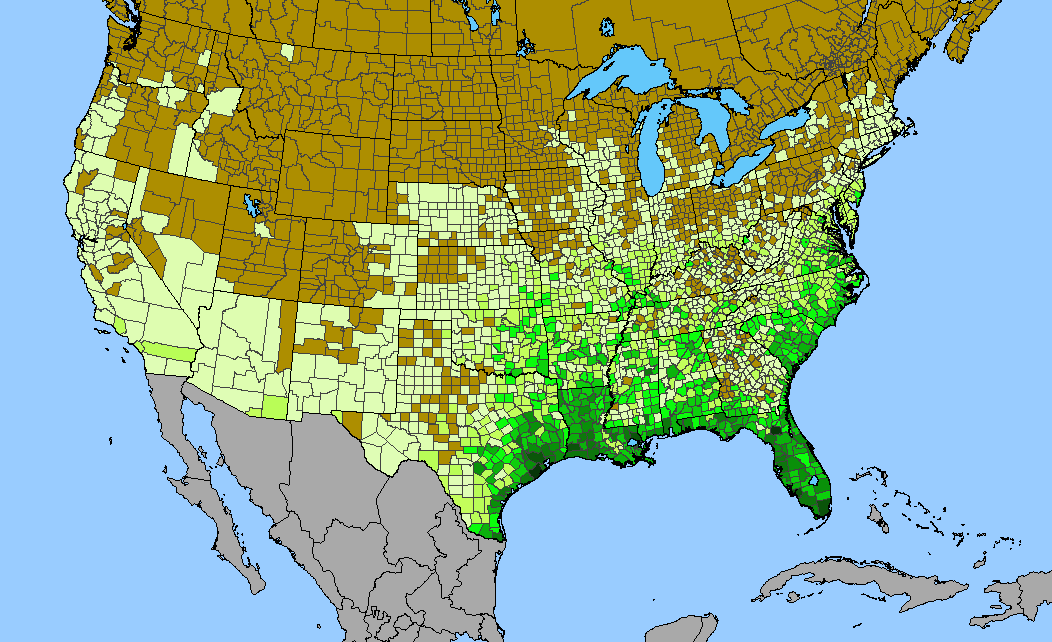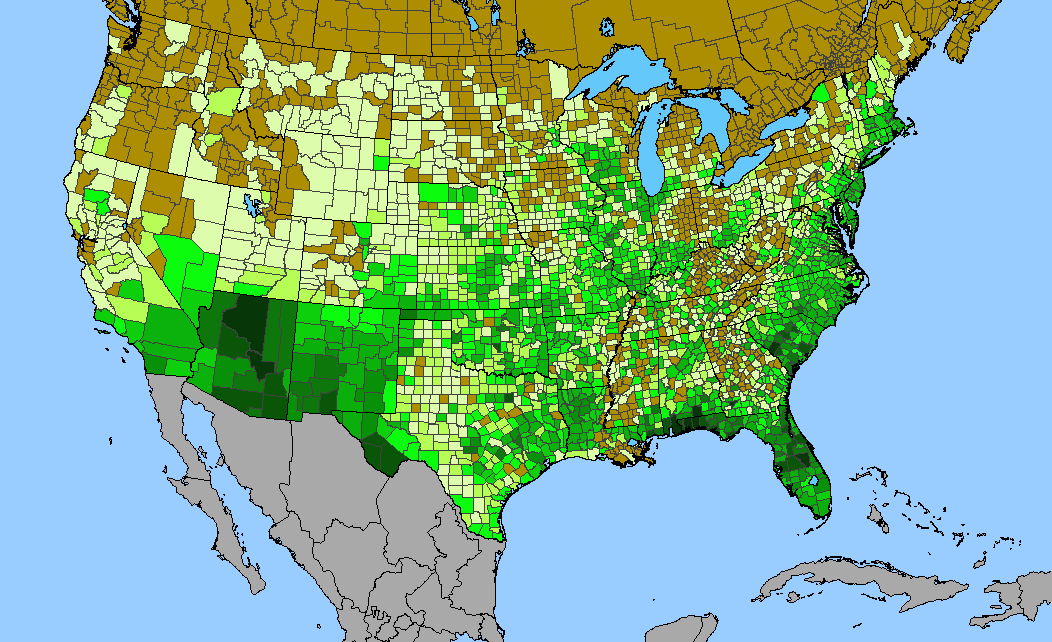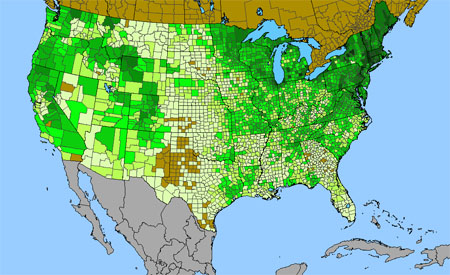
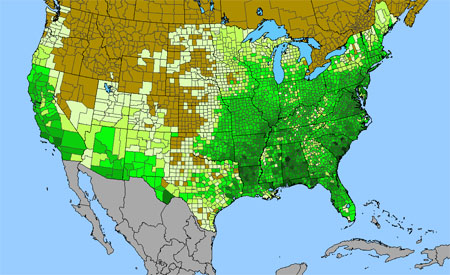
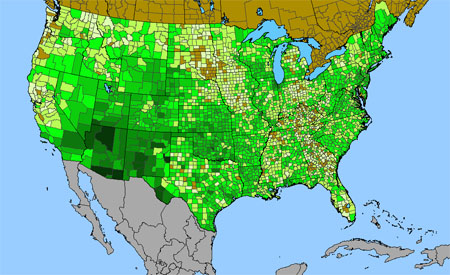
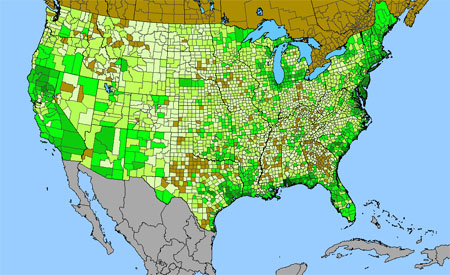
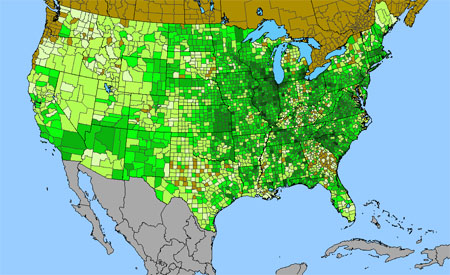
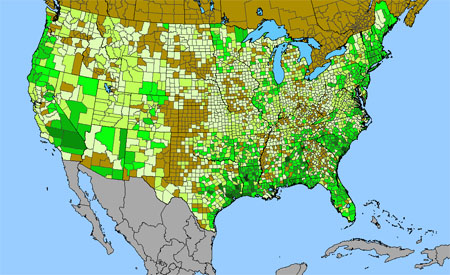
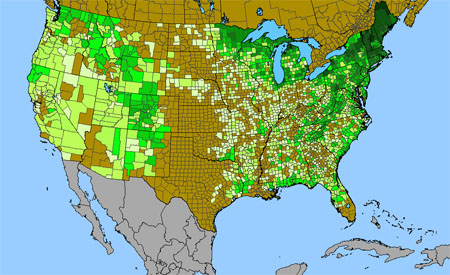
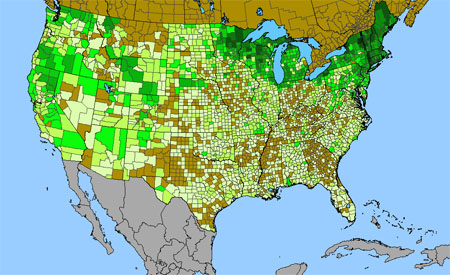
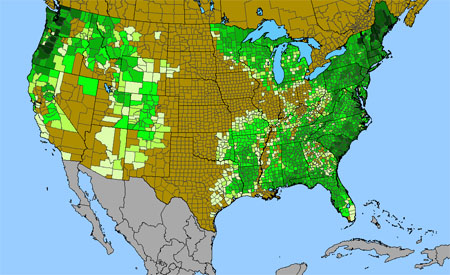
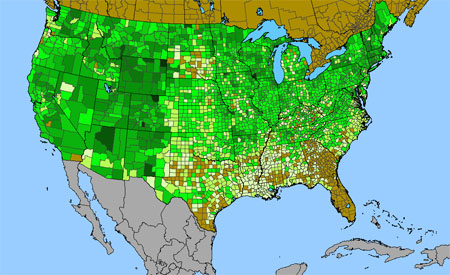
Density gradient of native species for Carex within the US (data 2011). Darkest green (130 spp. Litchfield County, CT) indicates the highest species concentration. ©BONAP | 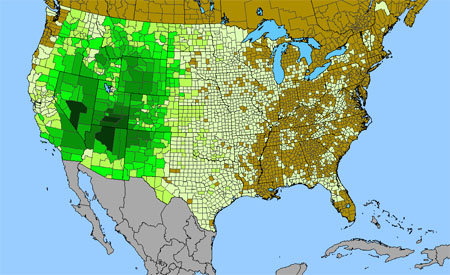
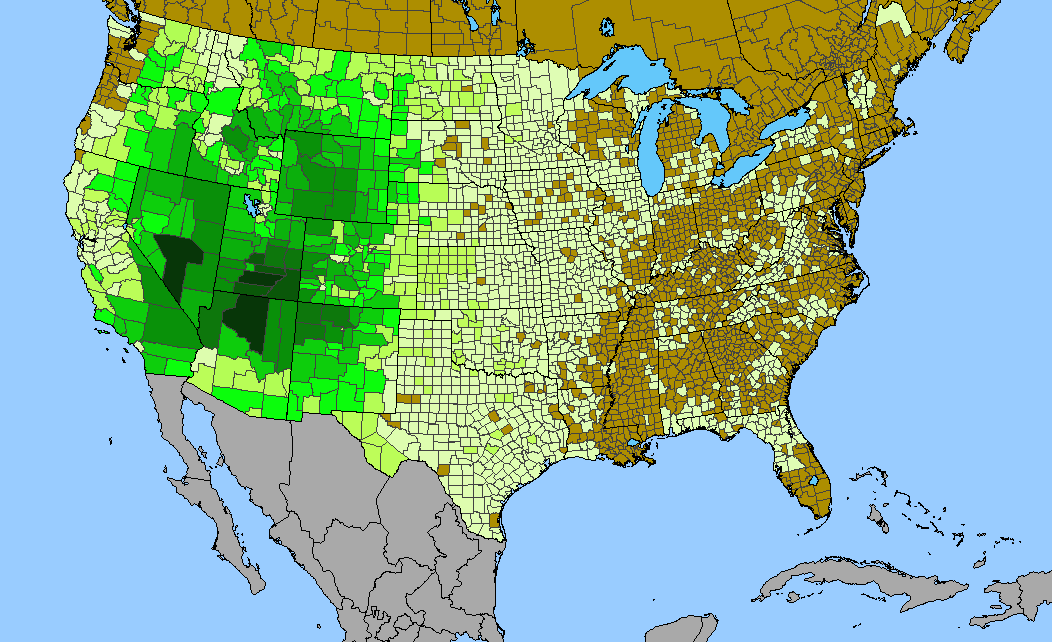
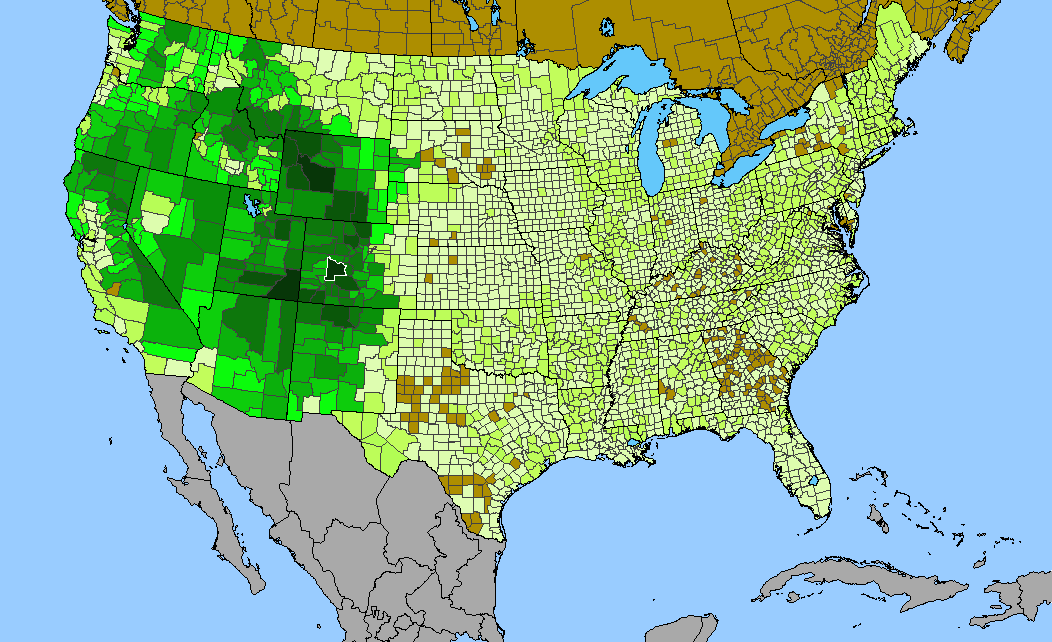
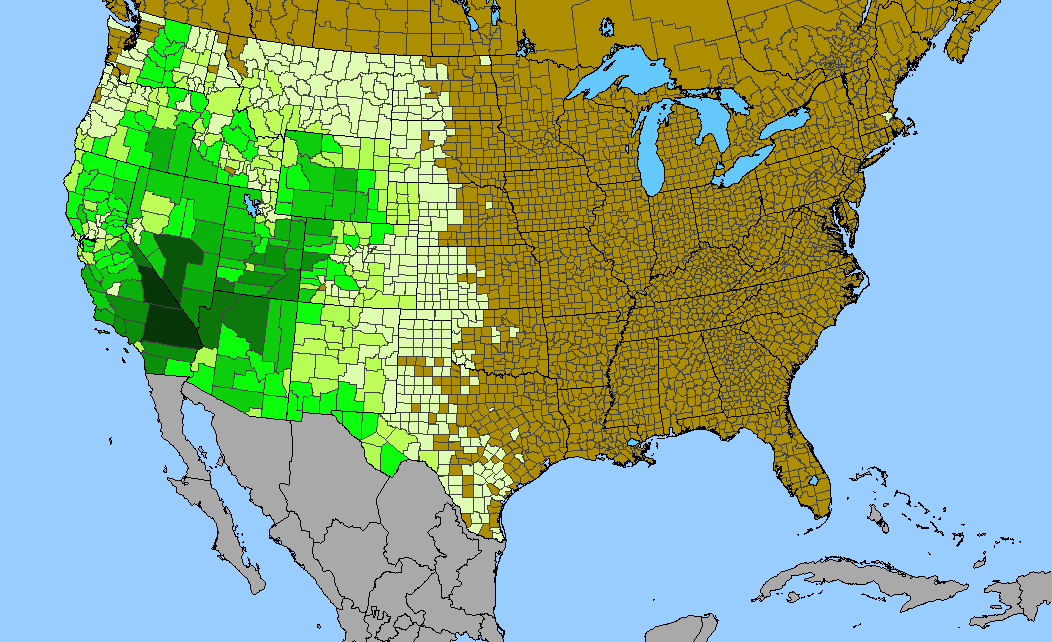
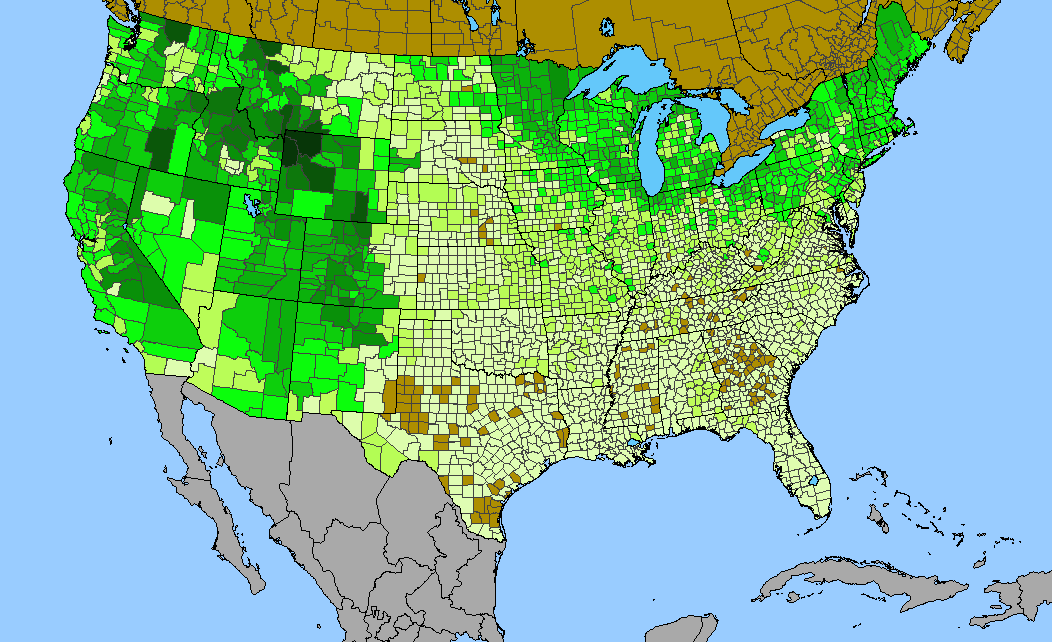
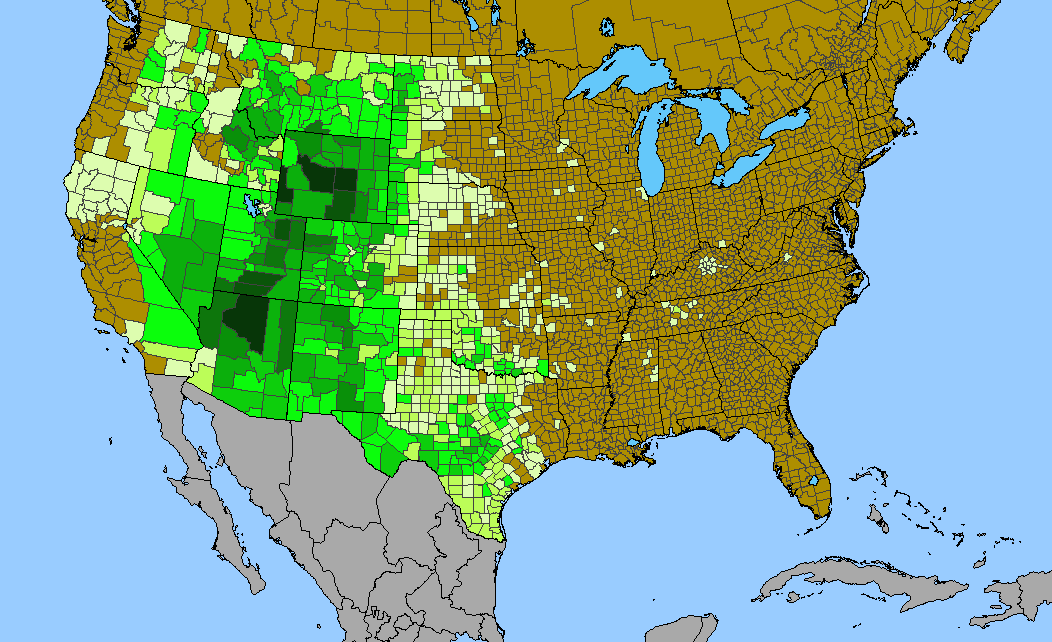
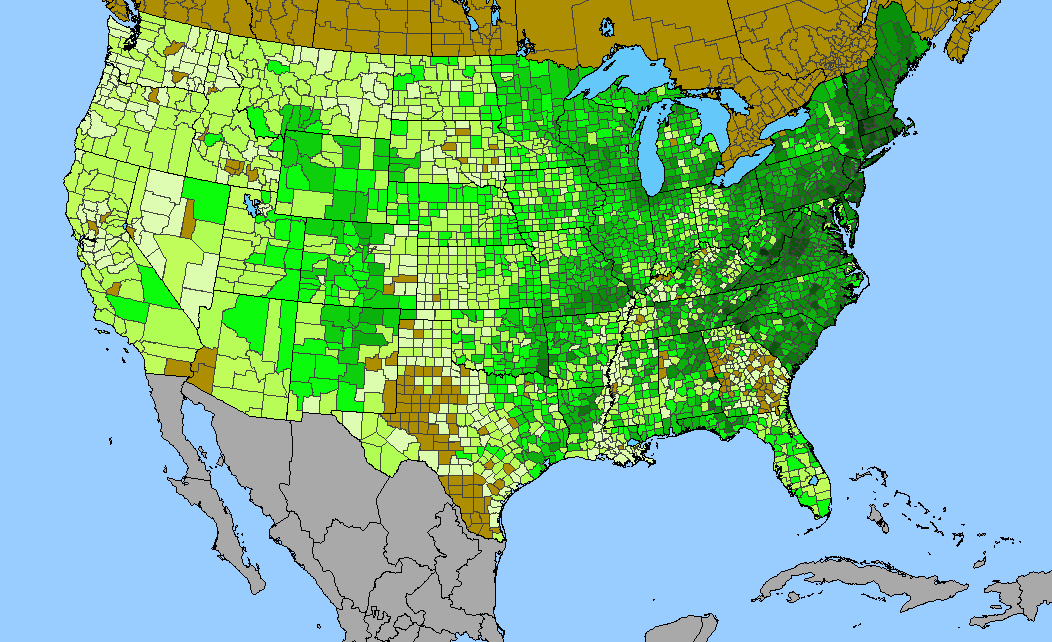
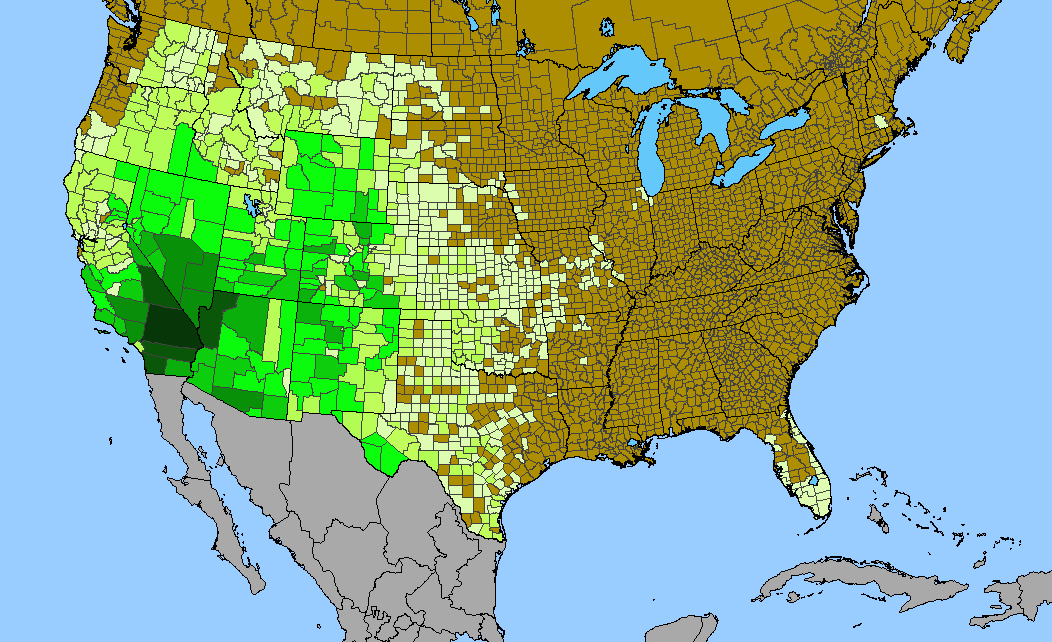
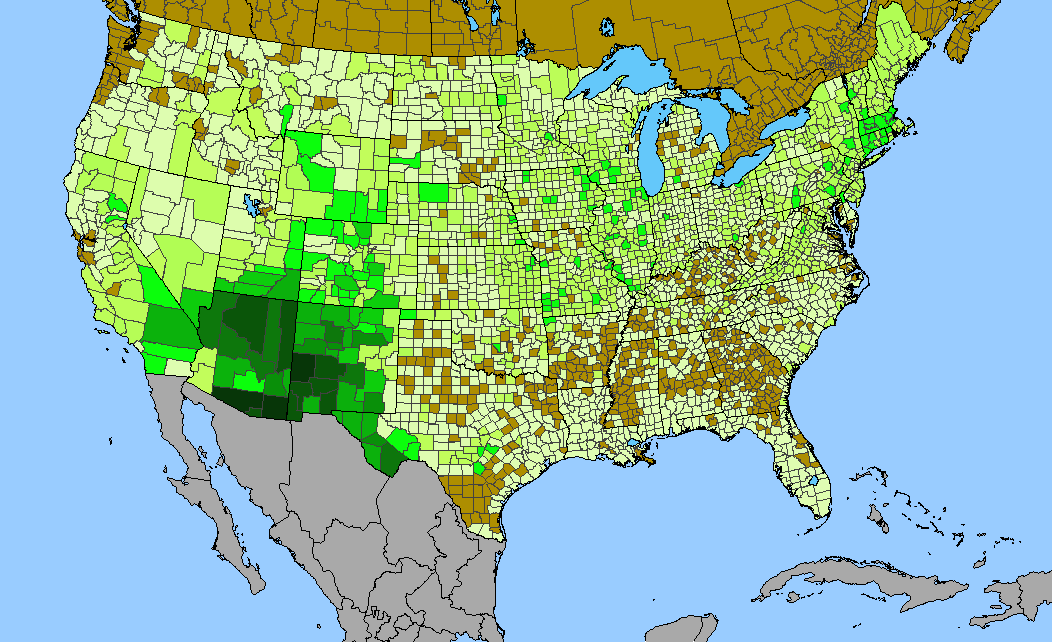
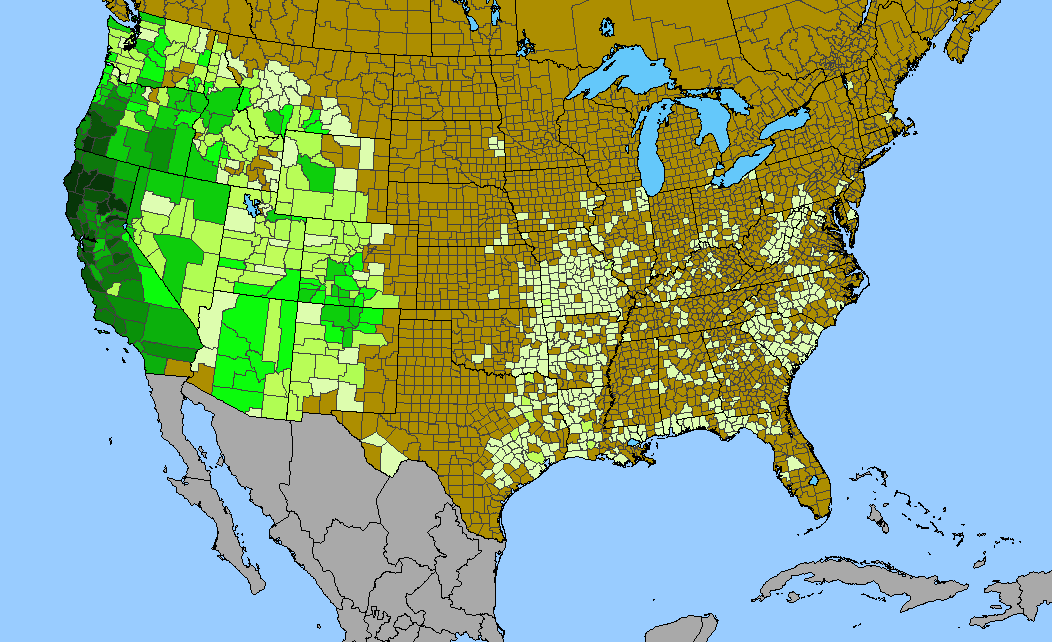
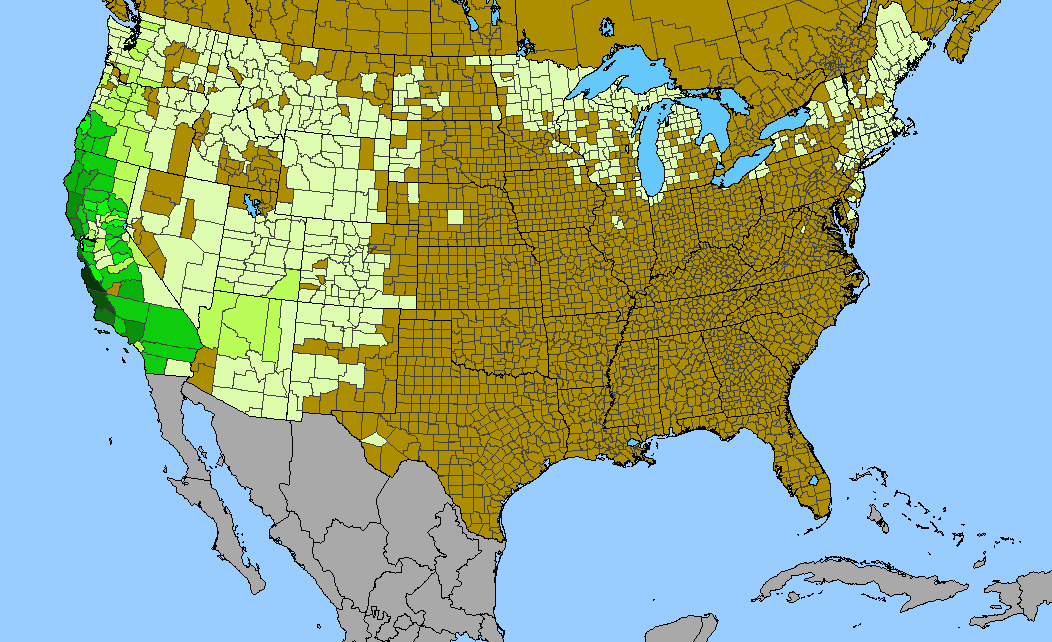
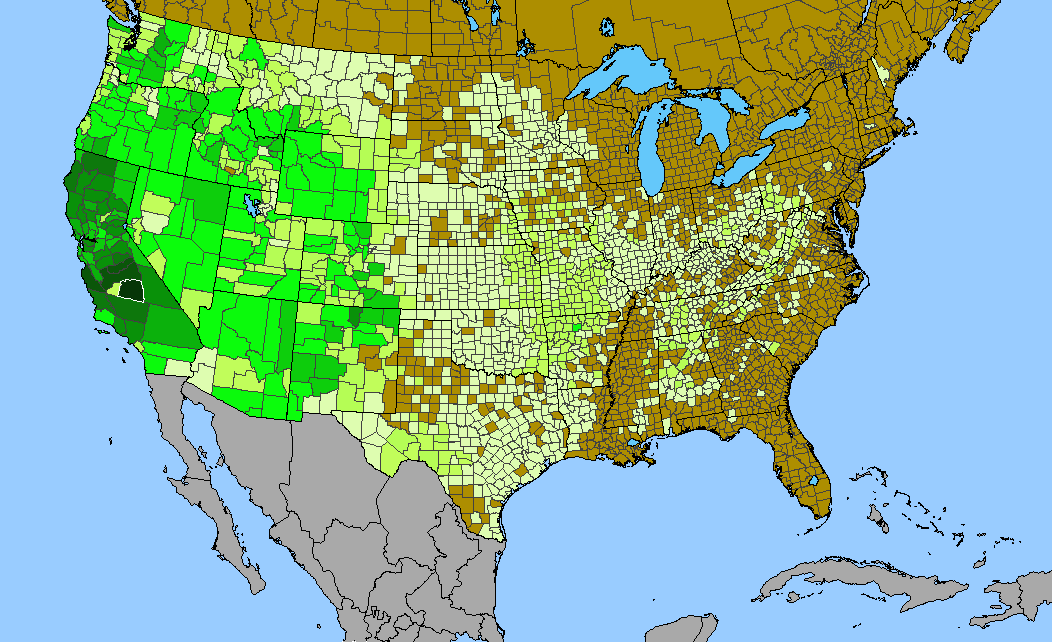
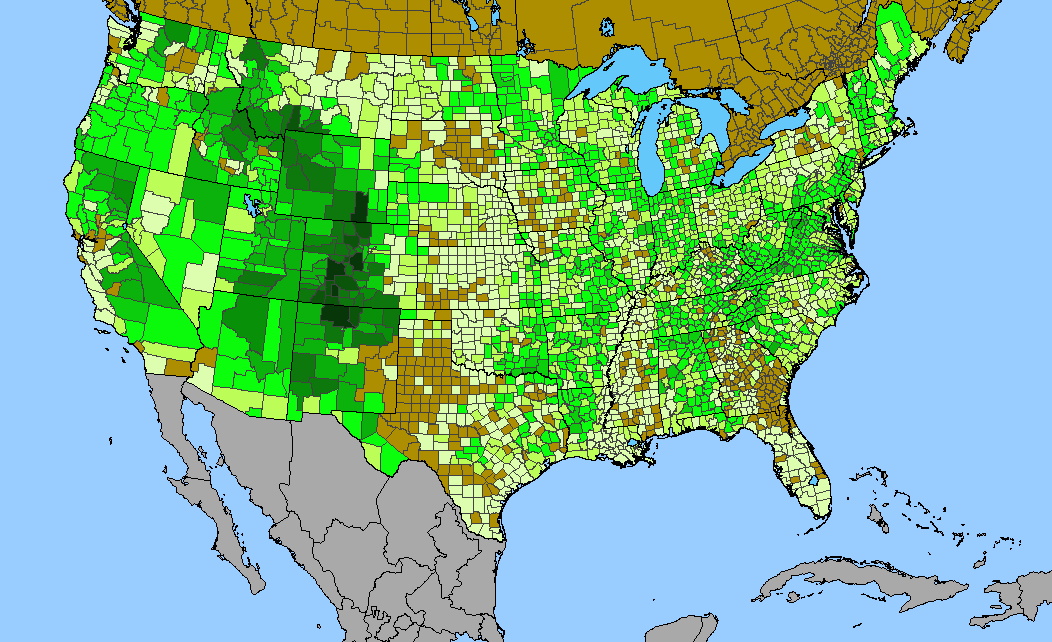
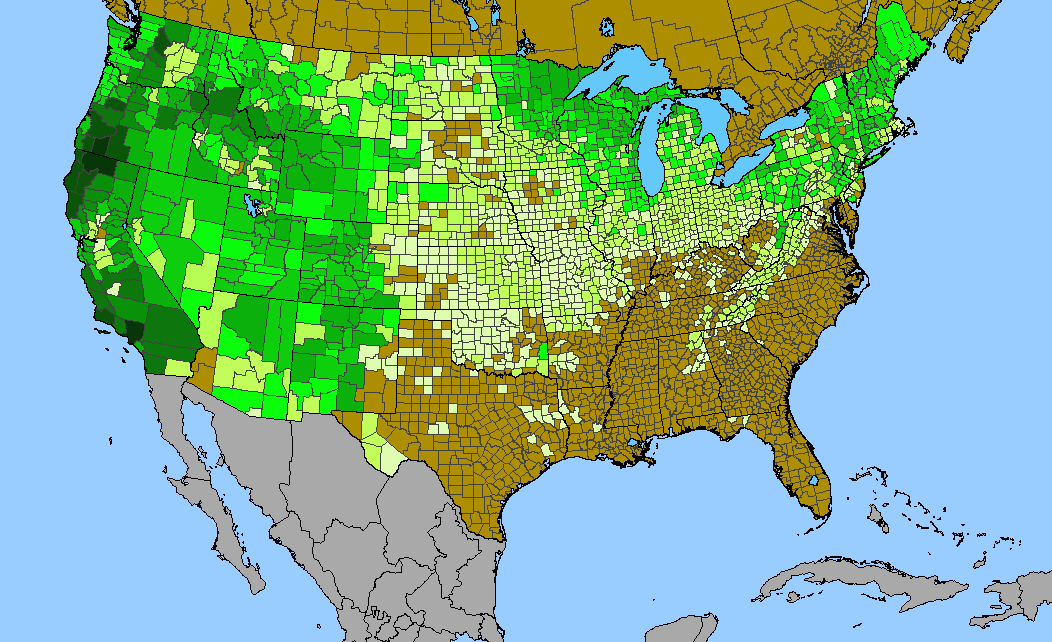
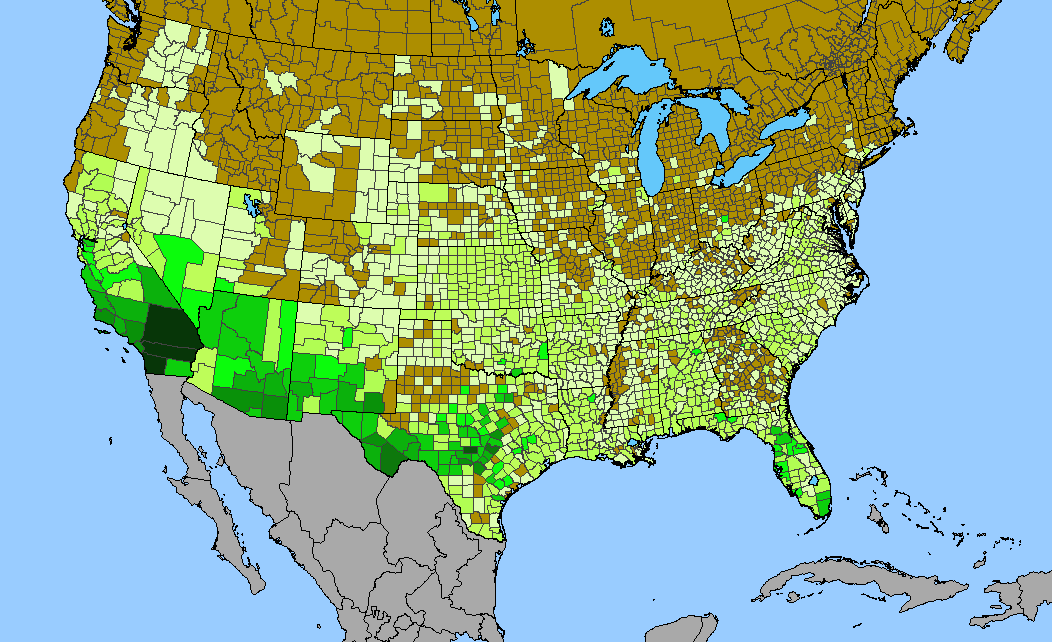
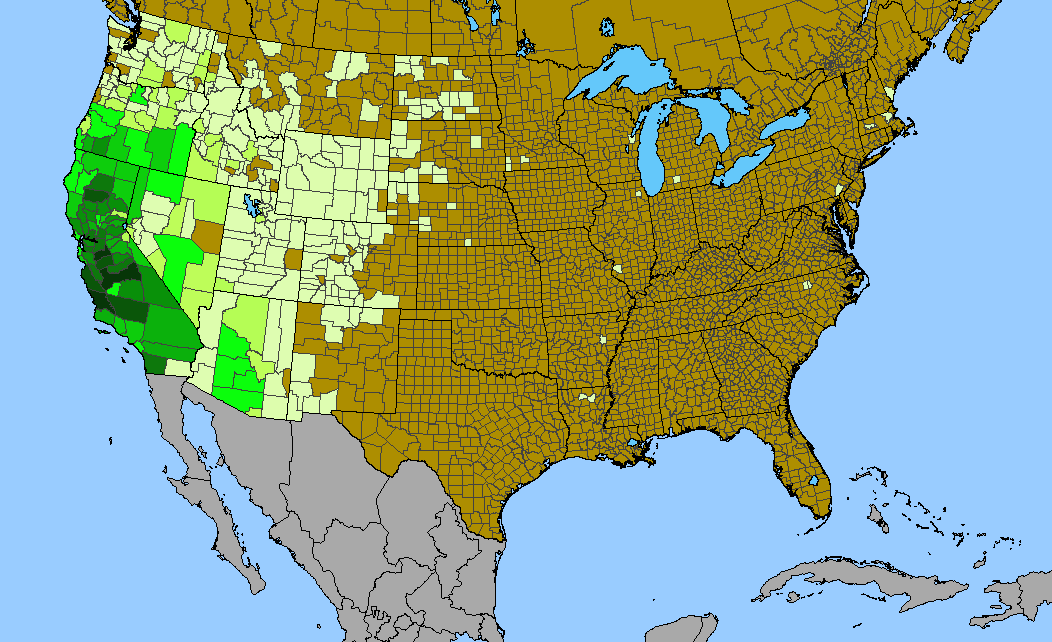
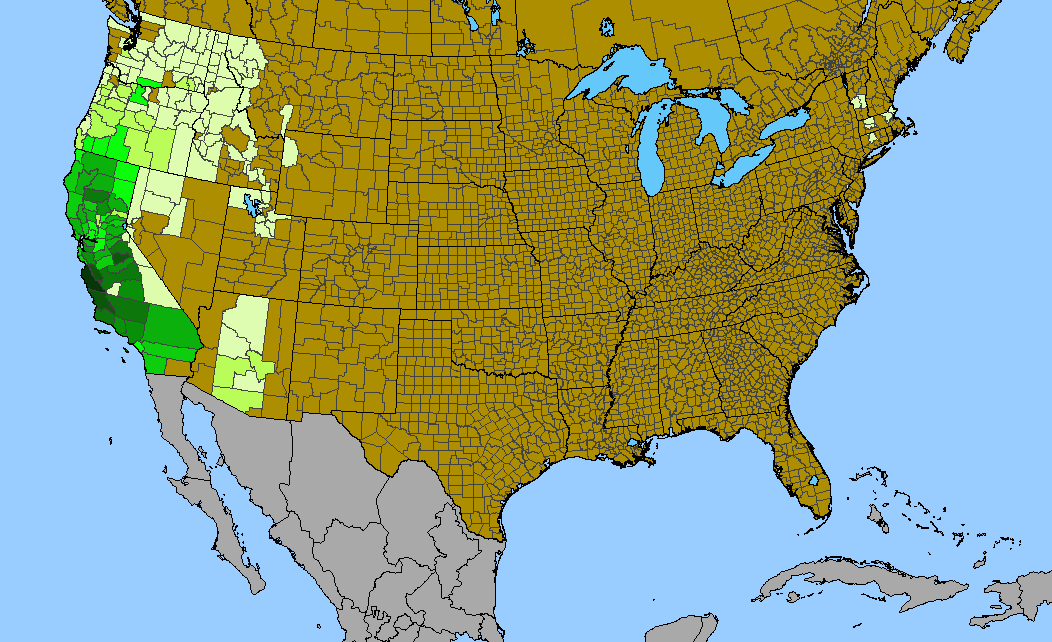
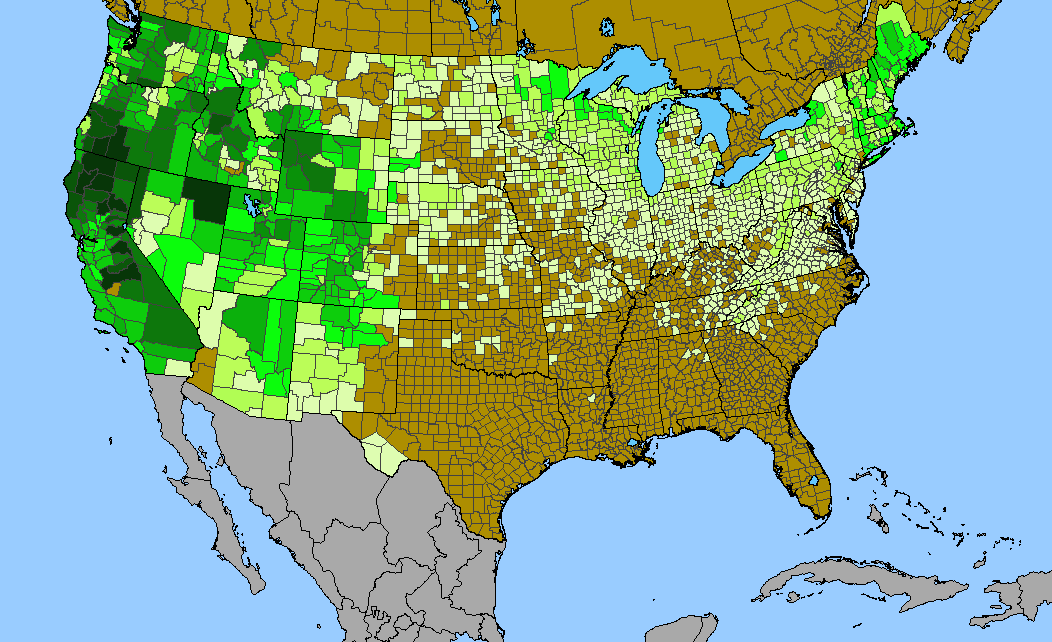
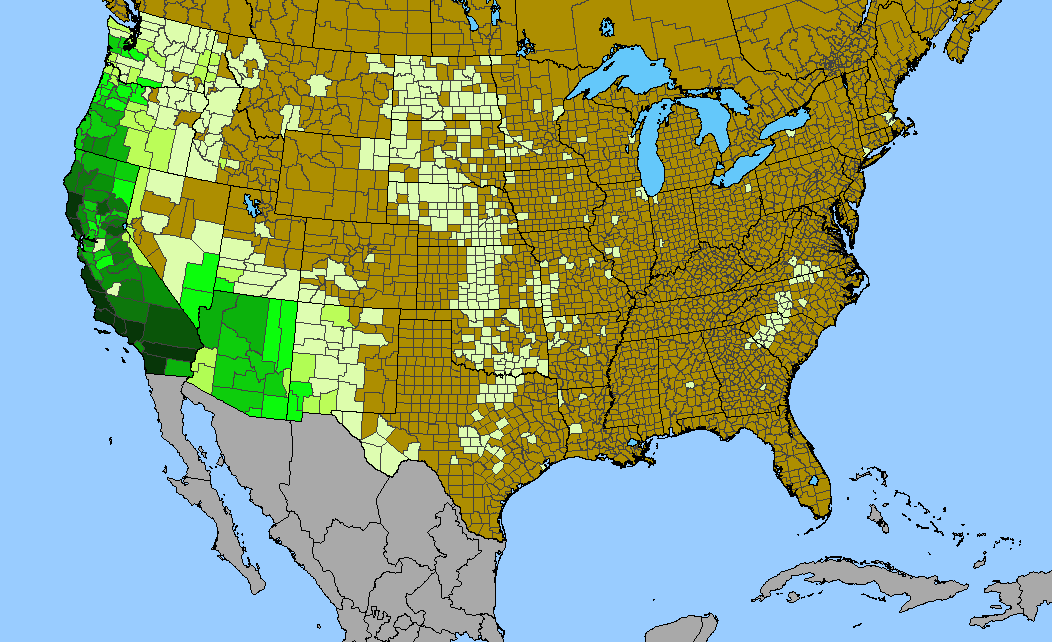
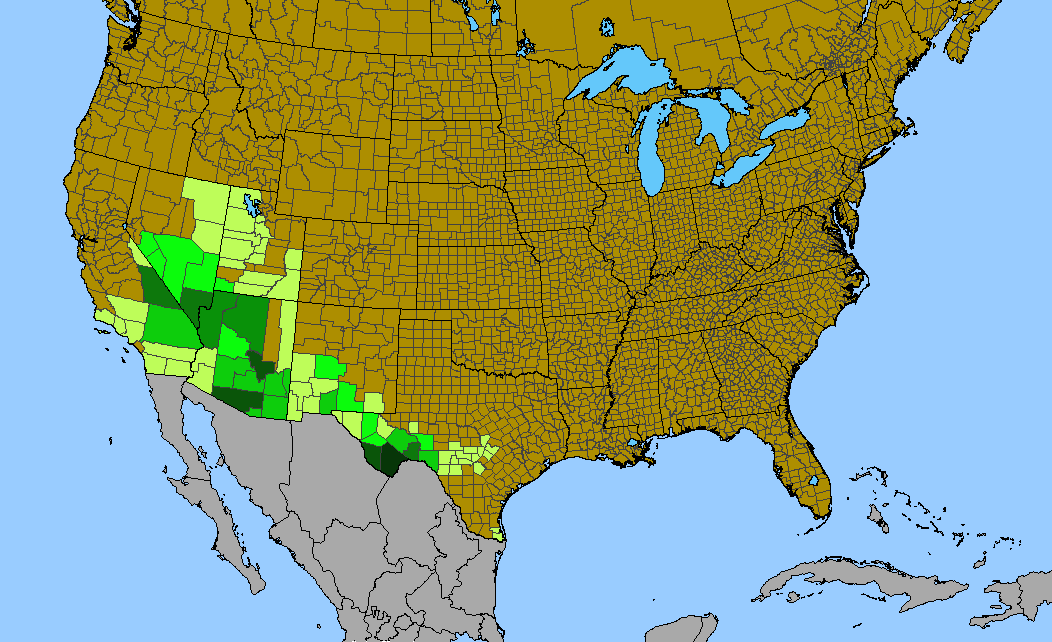
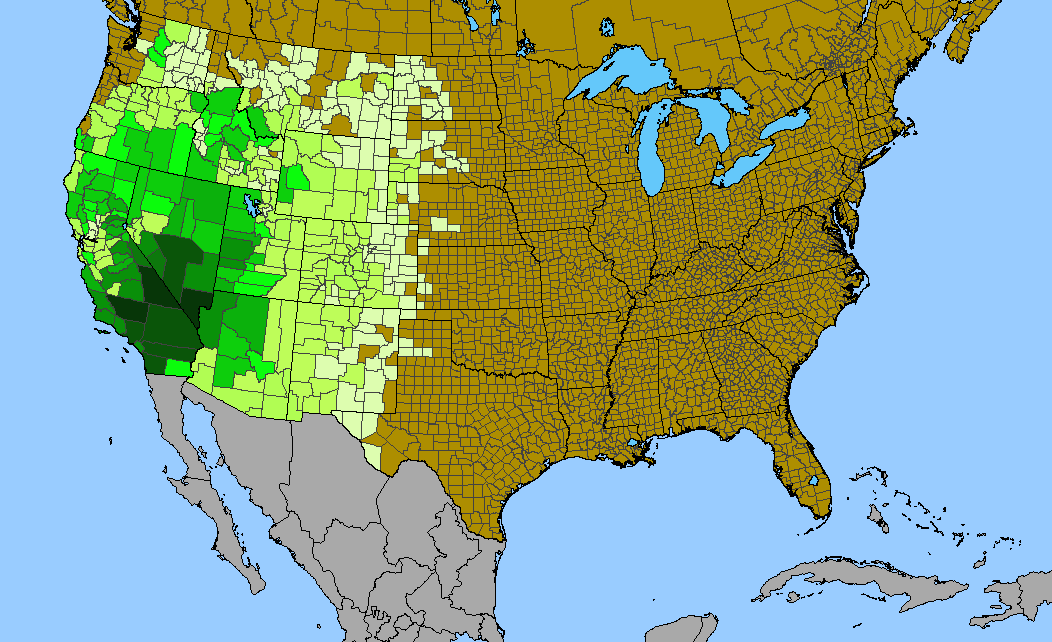
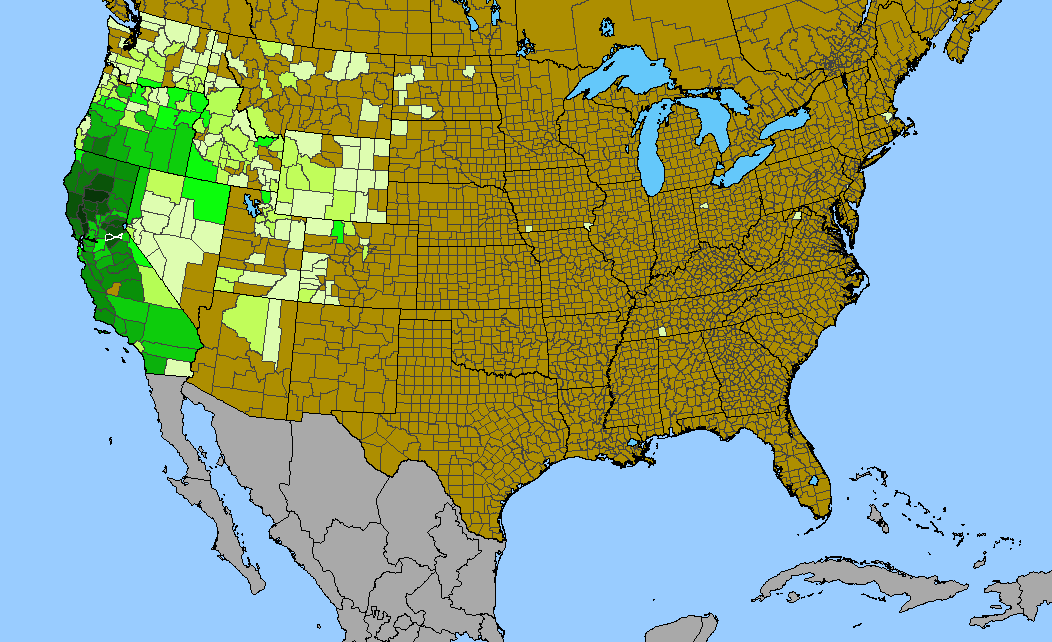
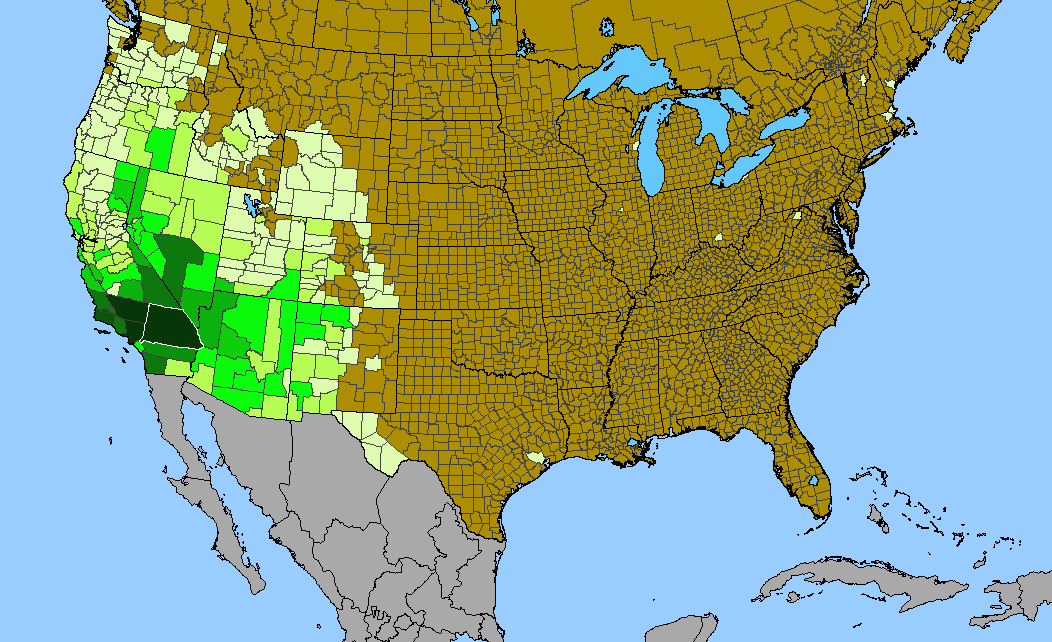
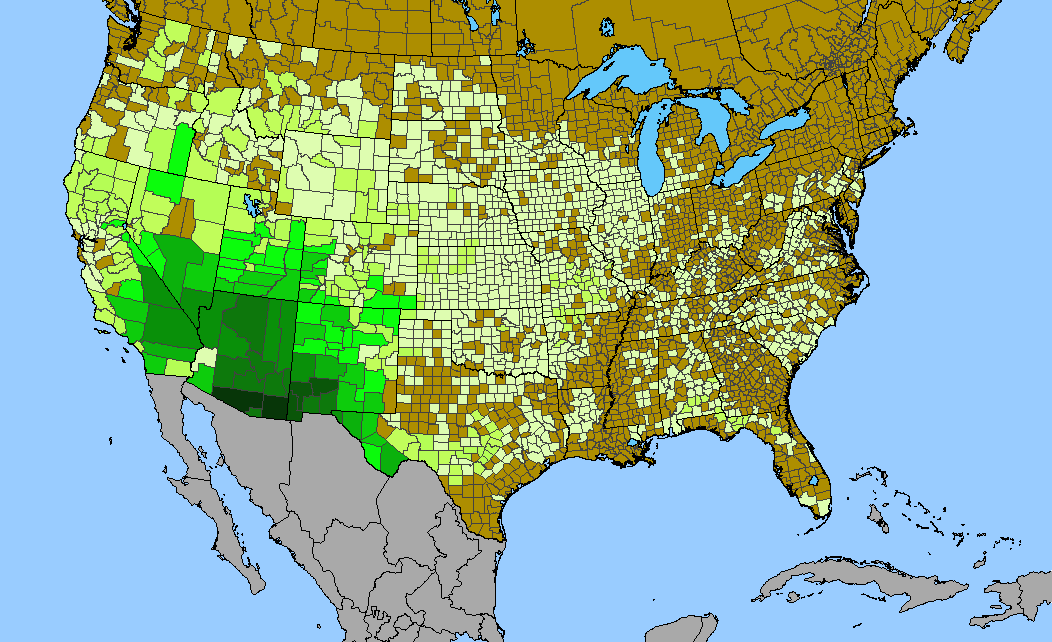
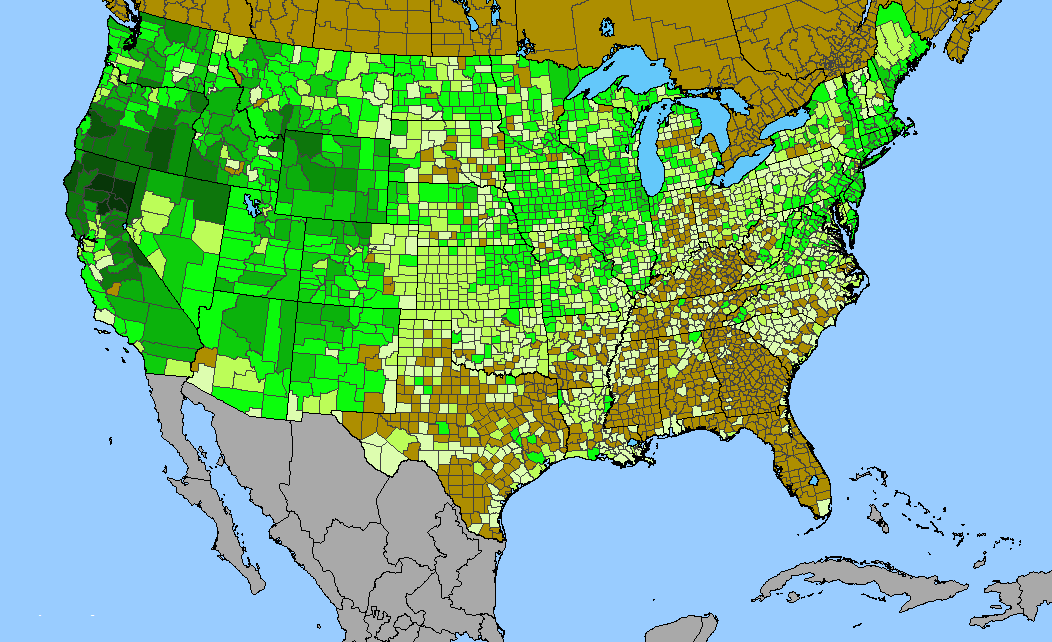
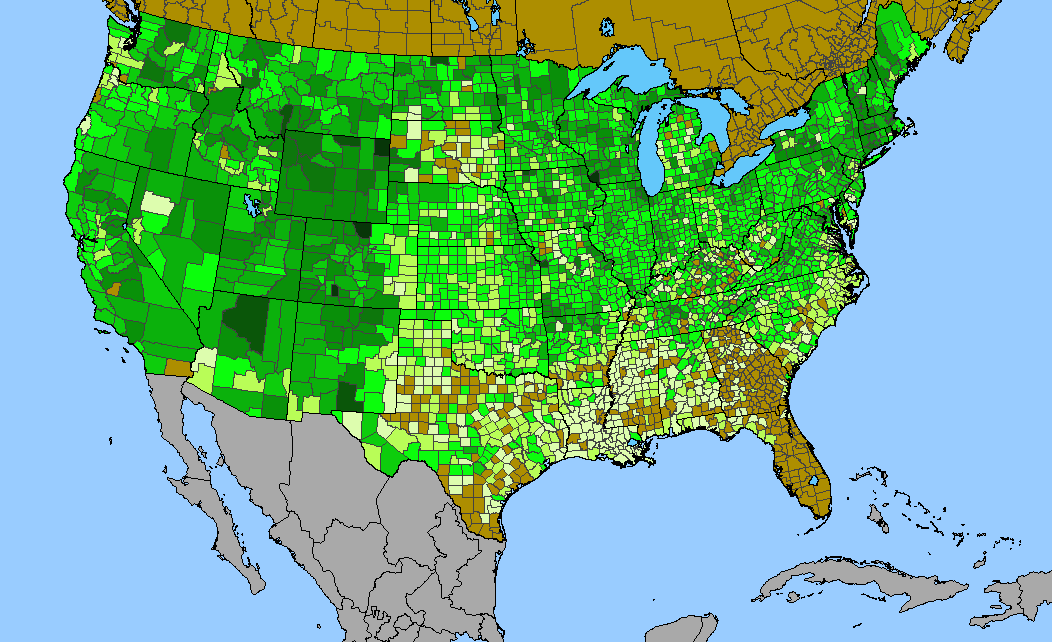
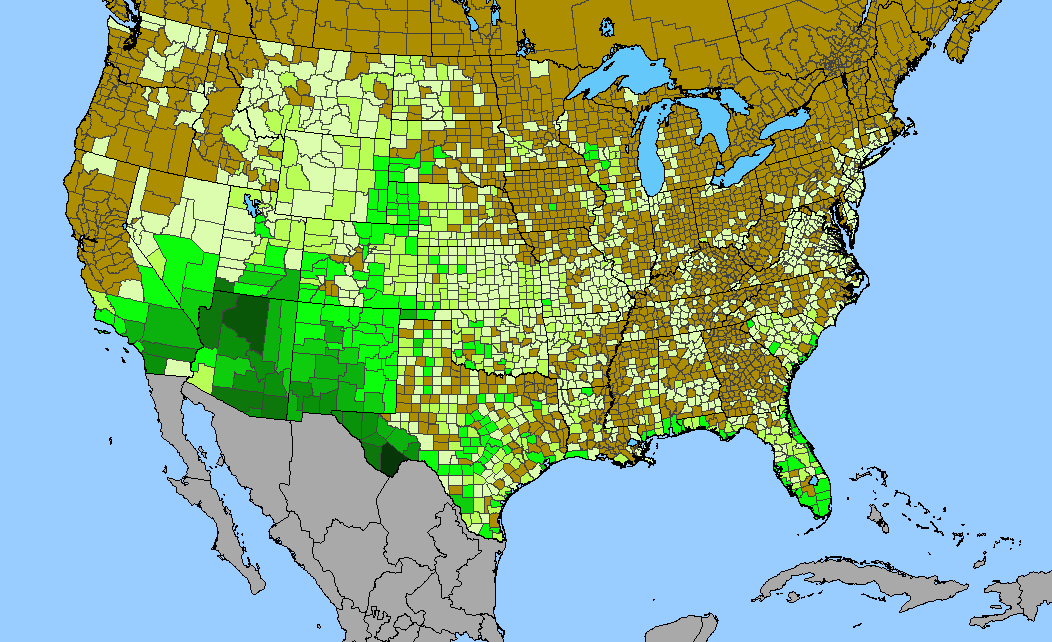
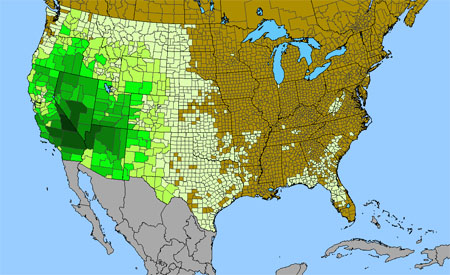
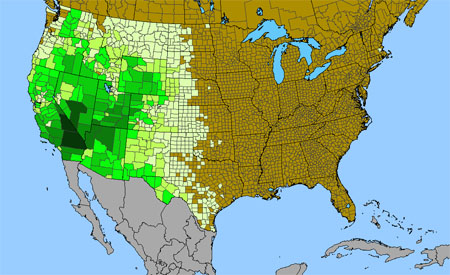
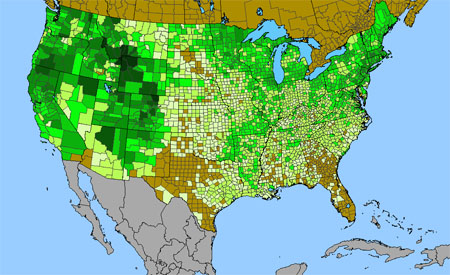
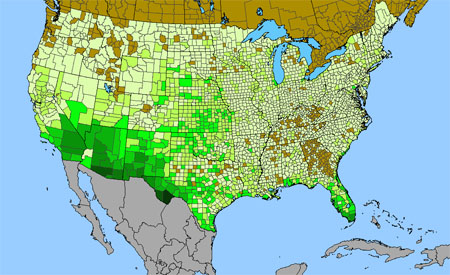
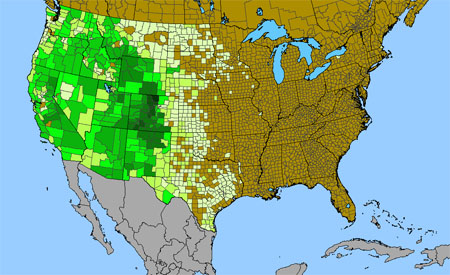
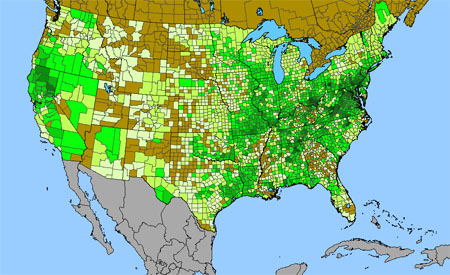
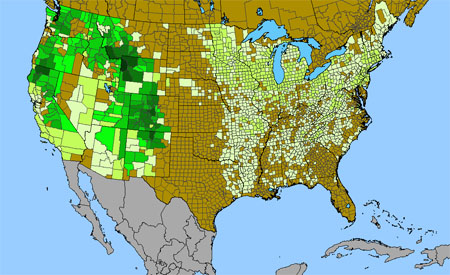
Density gradient of native species for Astragalus within the US (data 2011). Darkest green (57 spp. Garfield County, UT) indicates the highest species concentration. ©BONAP | 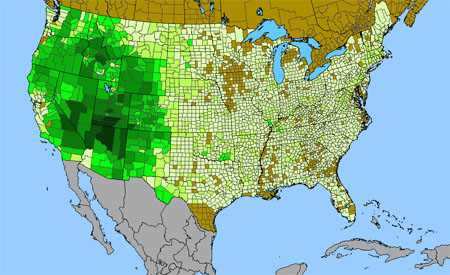
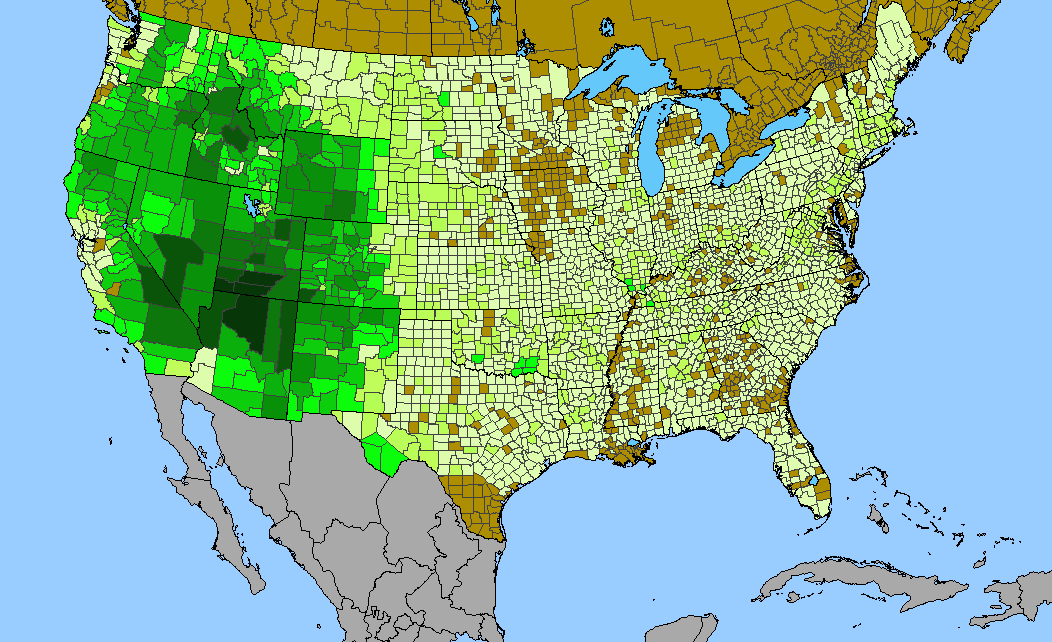
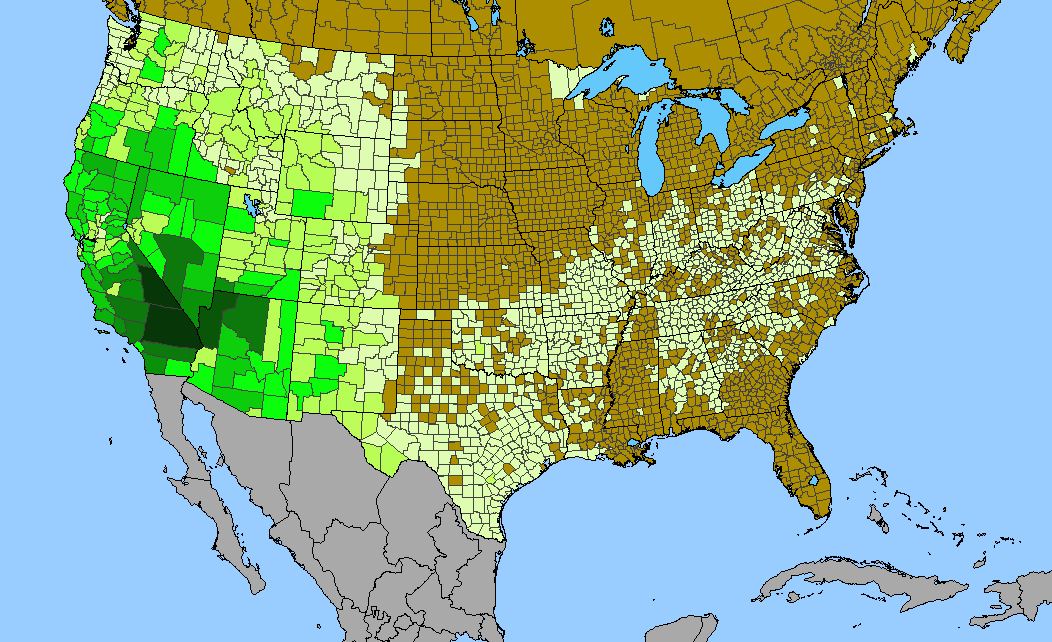
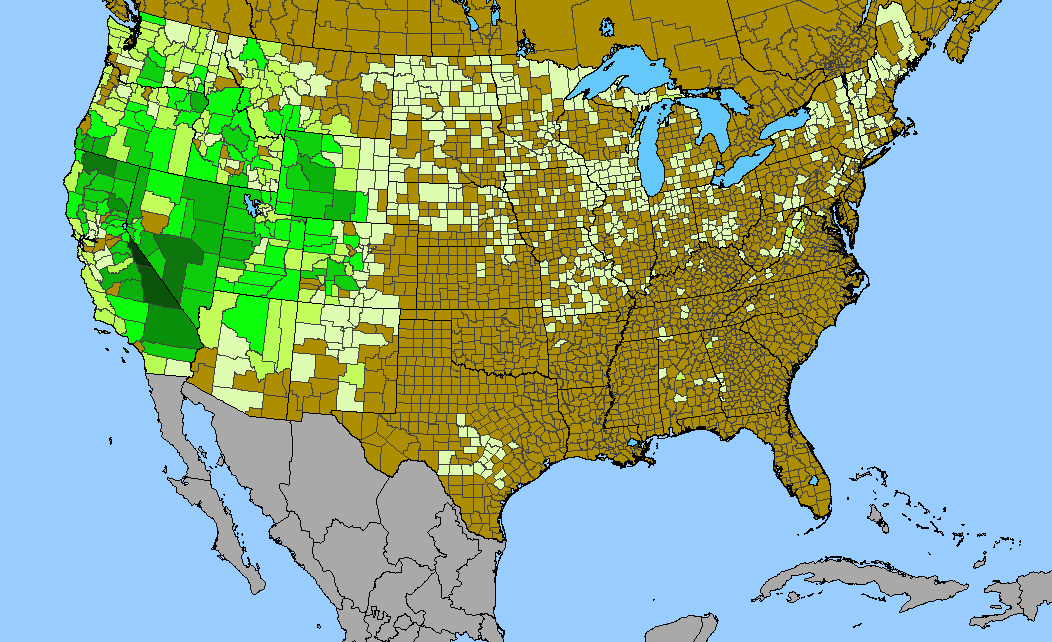
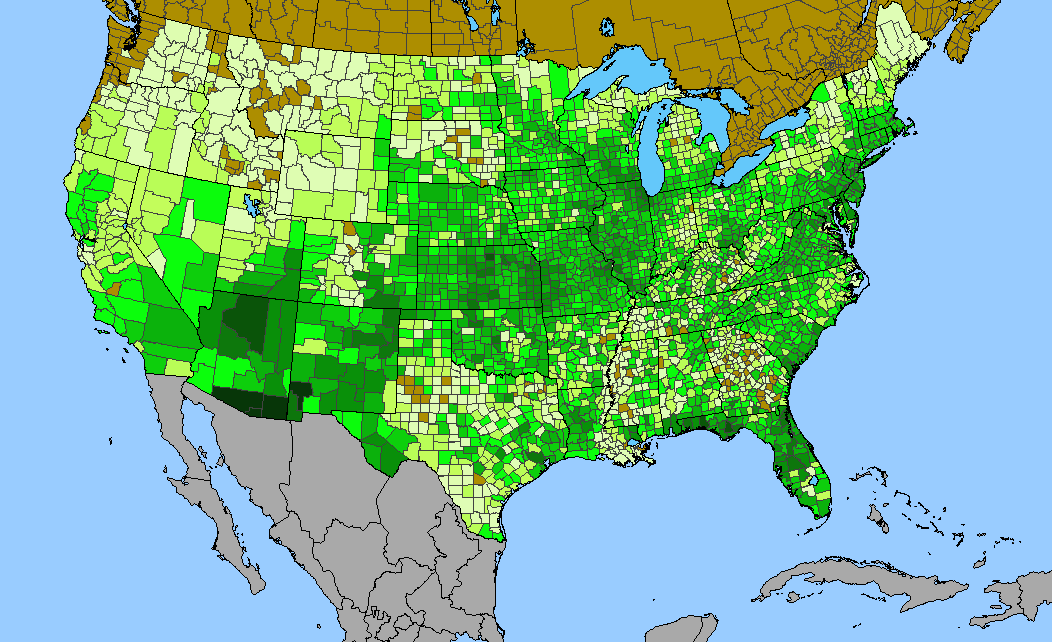
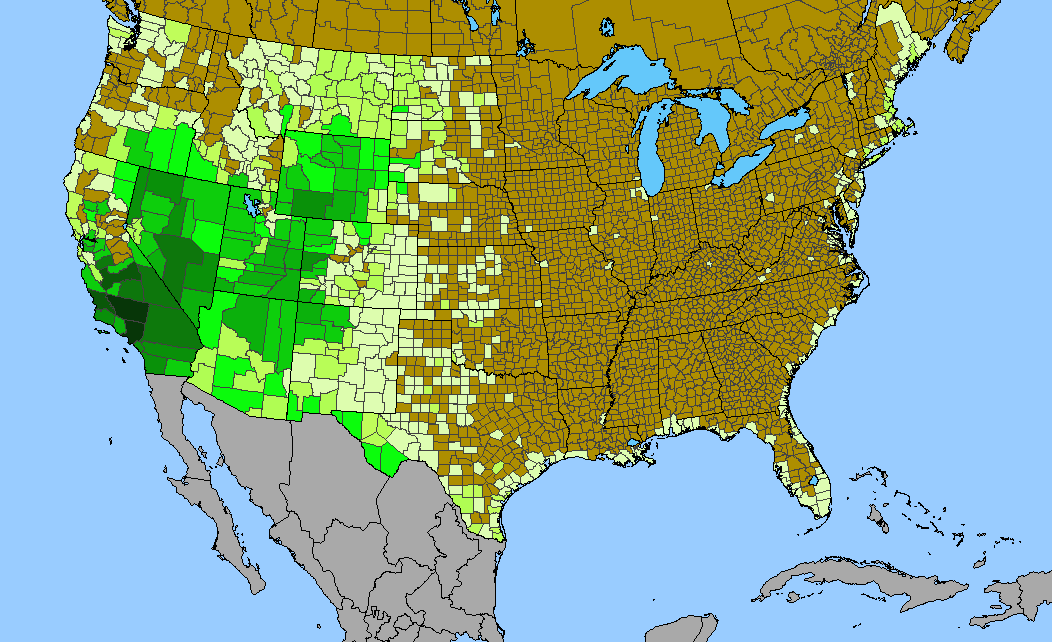
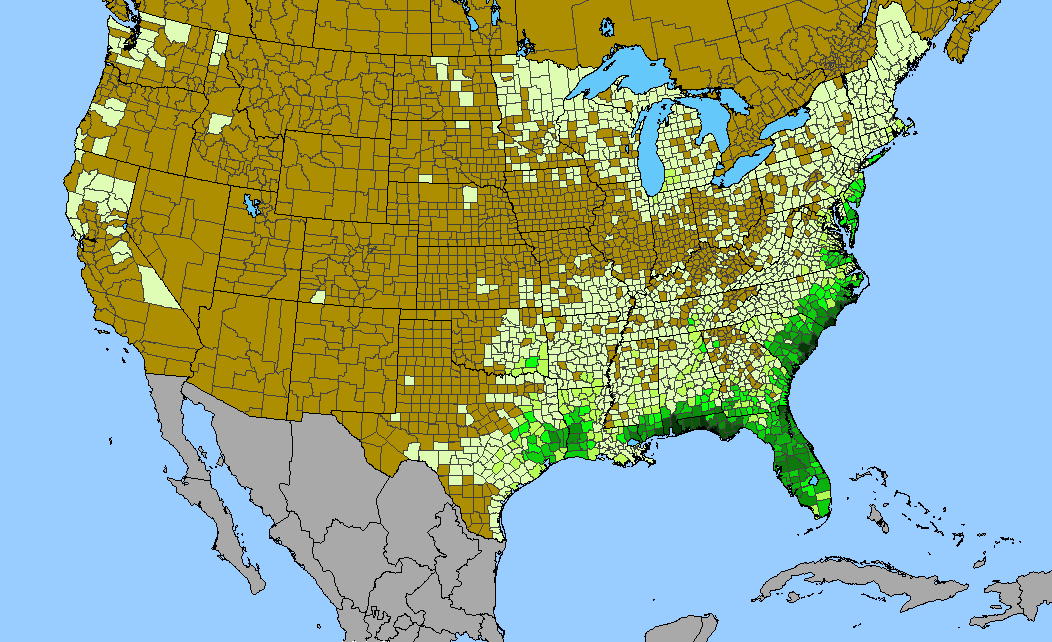
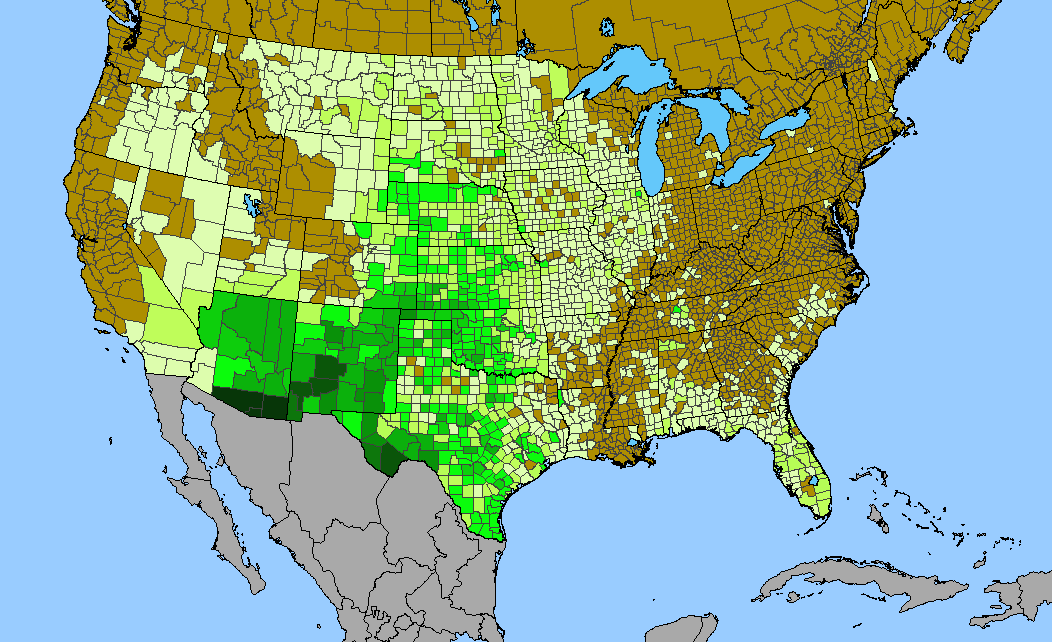
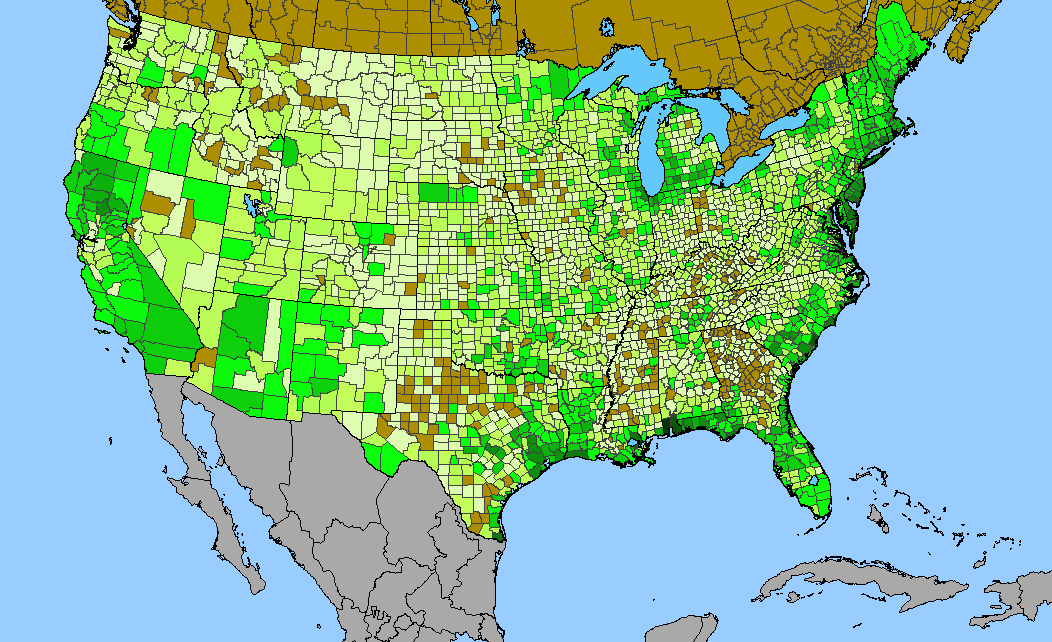
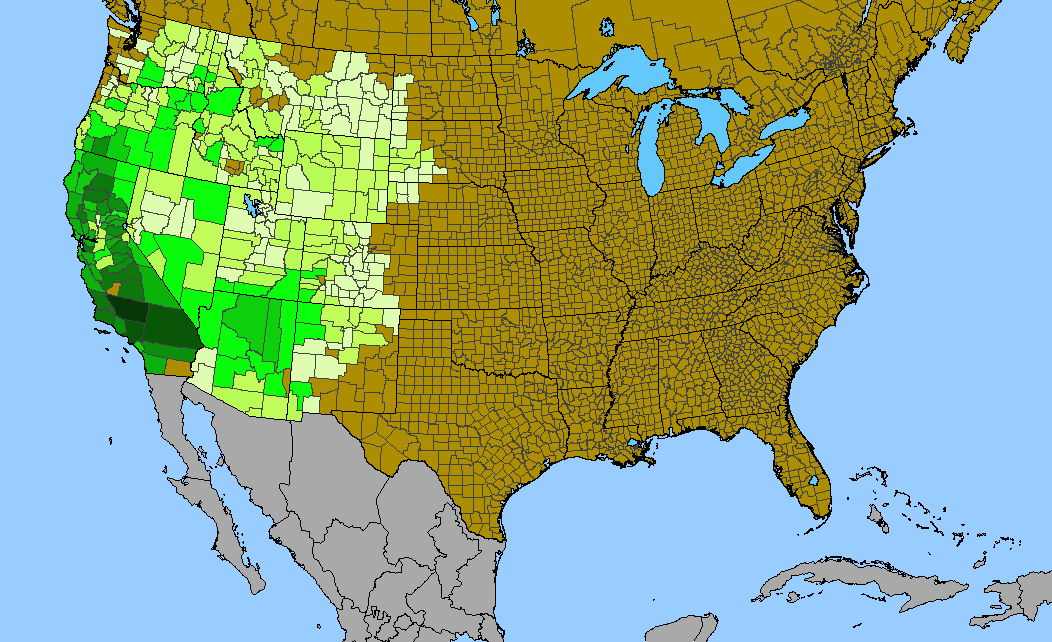
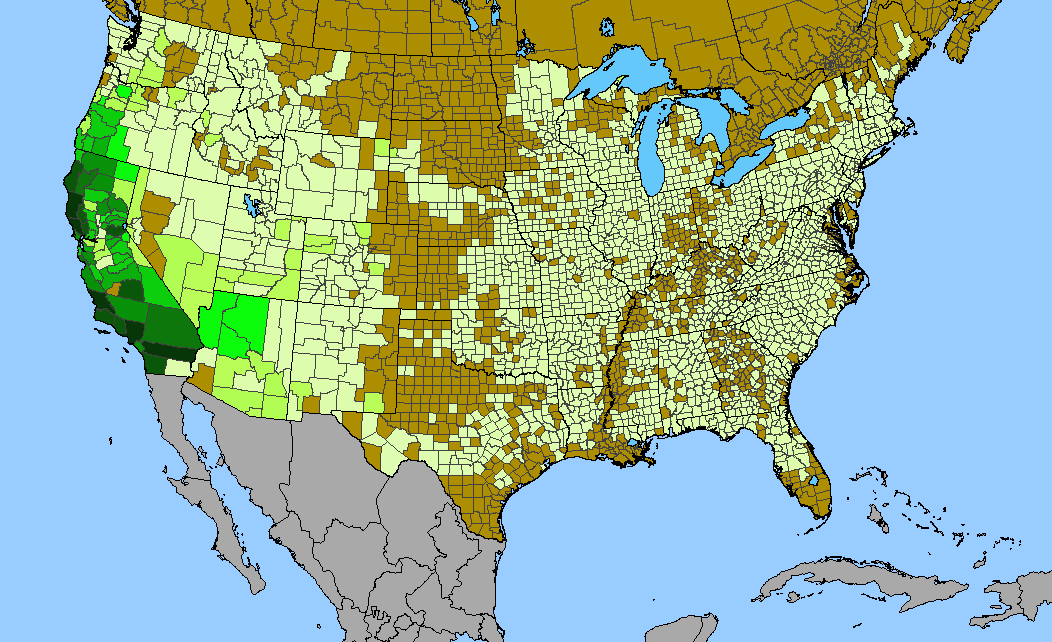
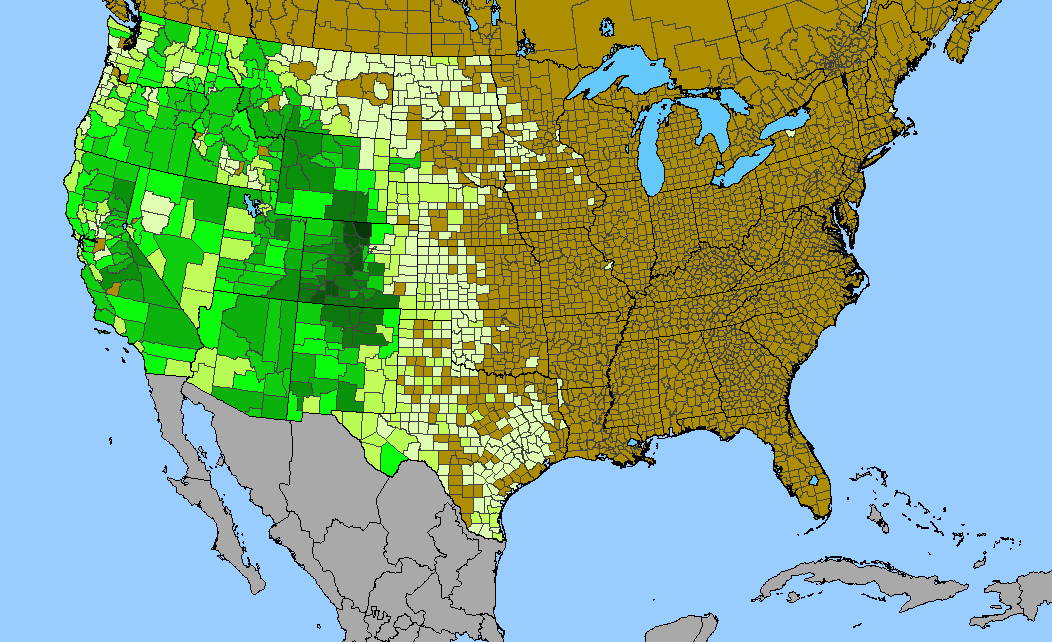
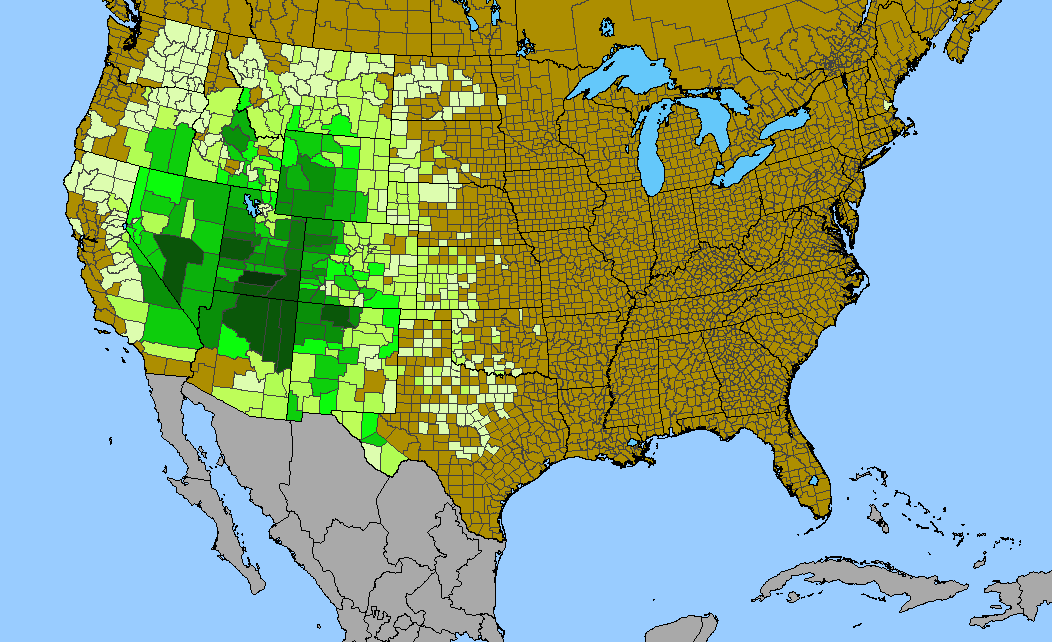
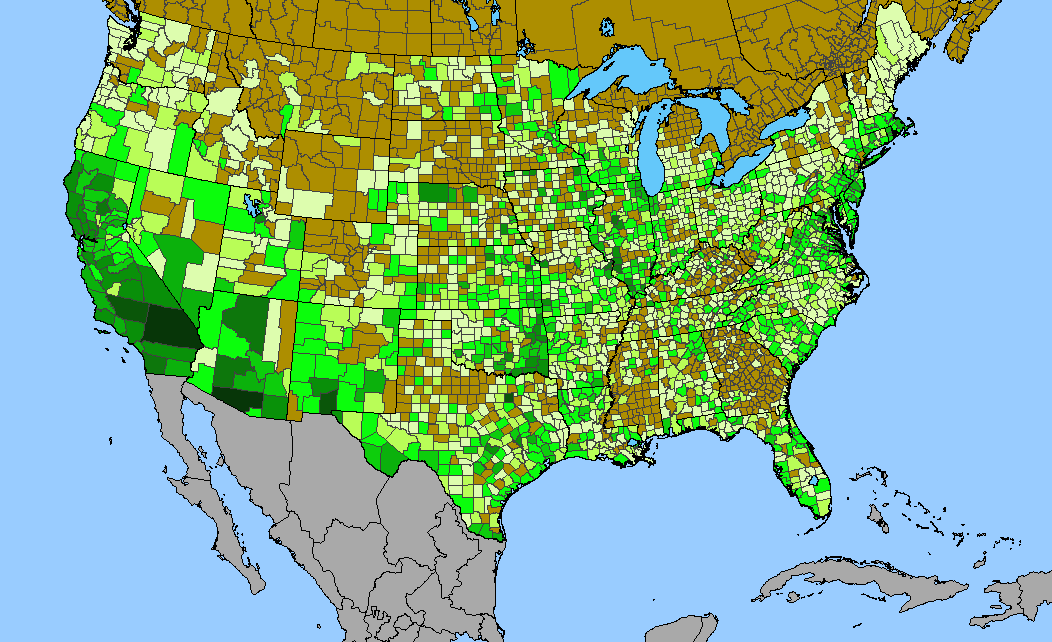
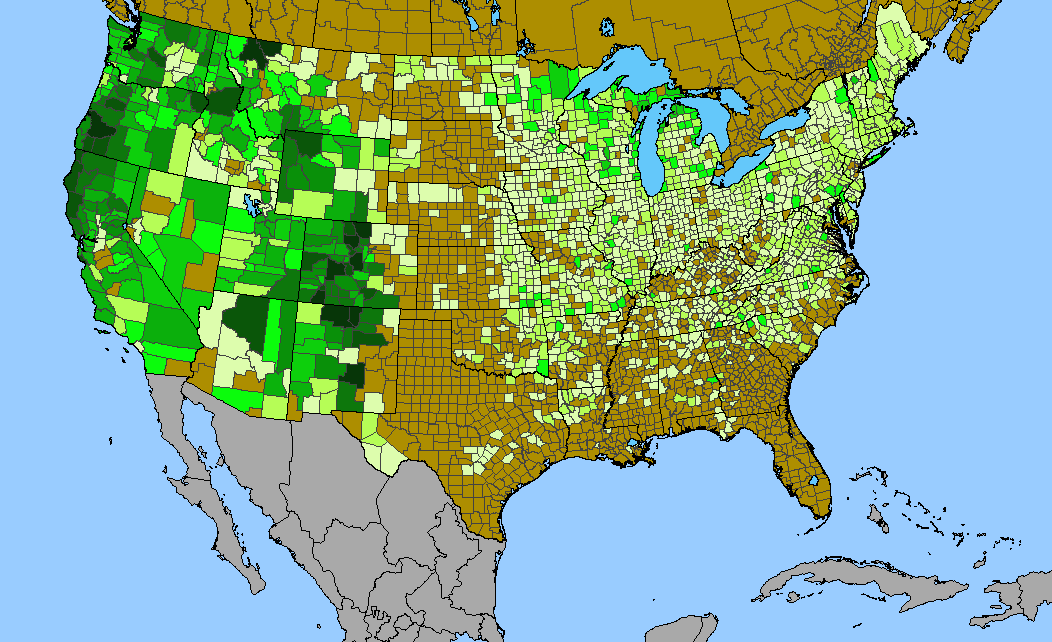
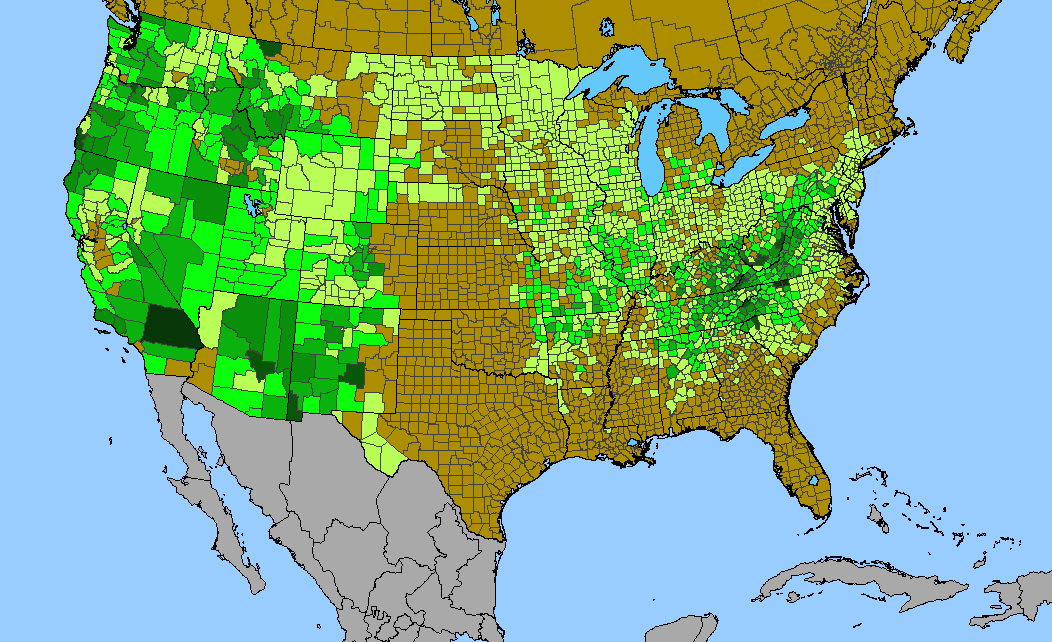
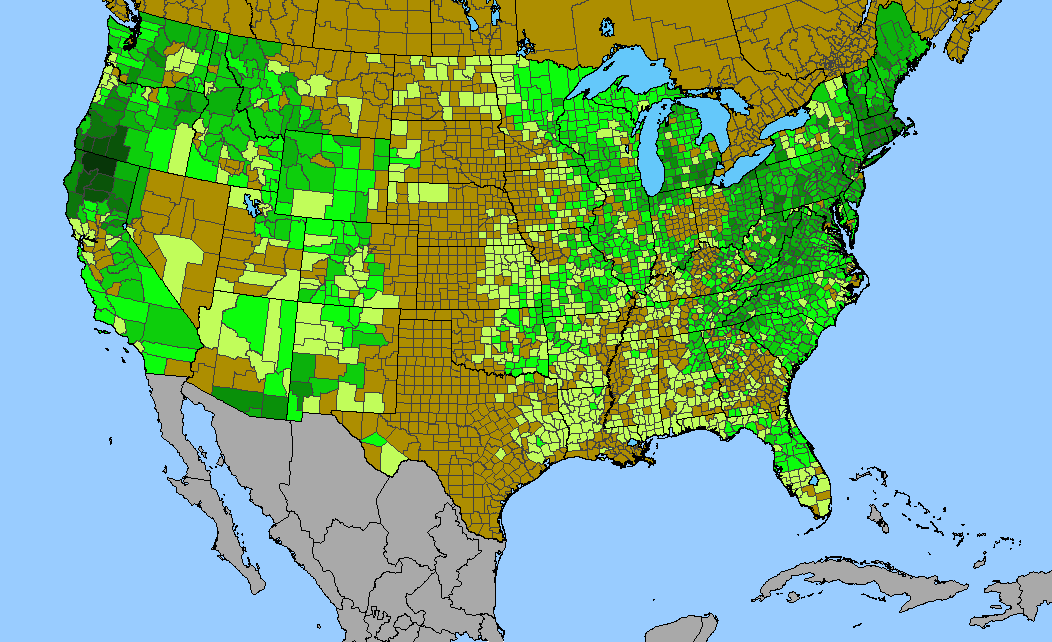
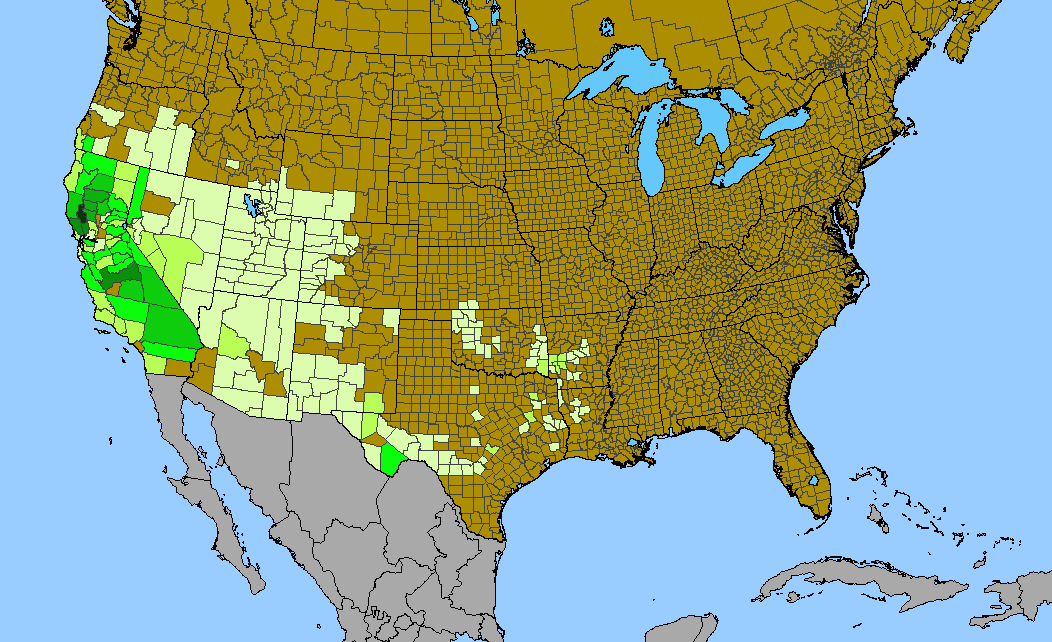
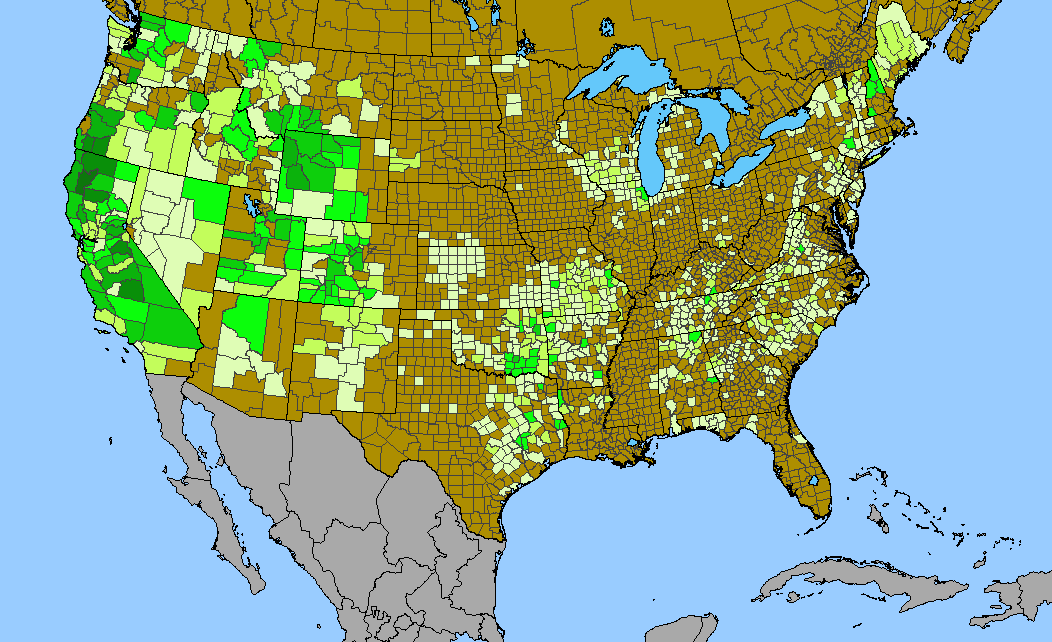
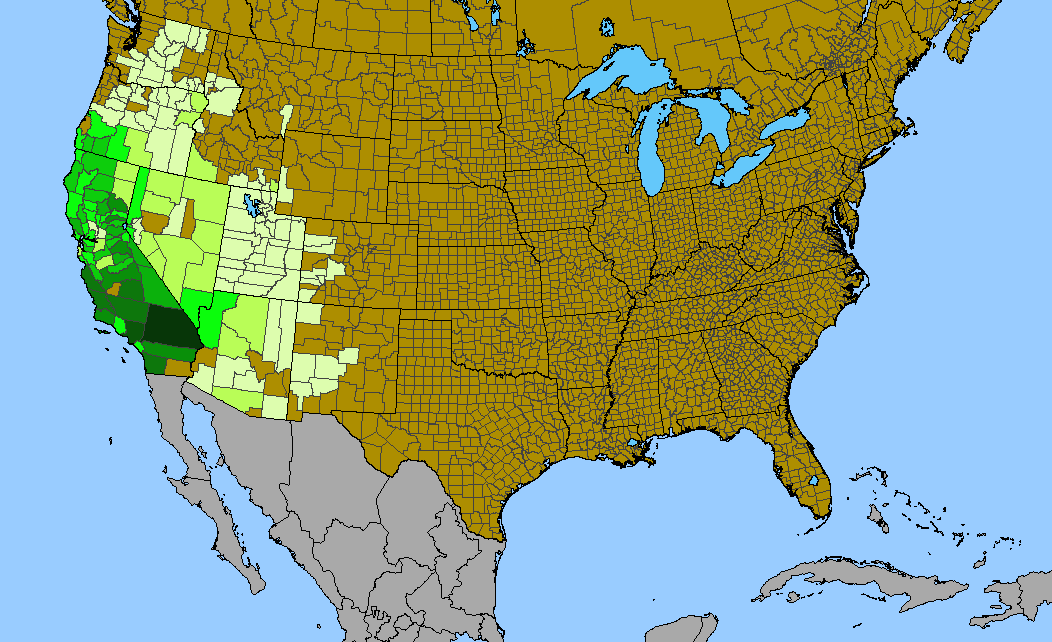
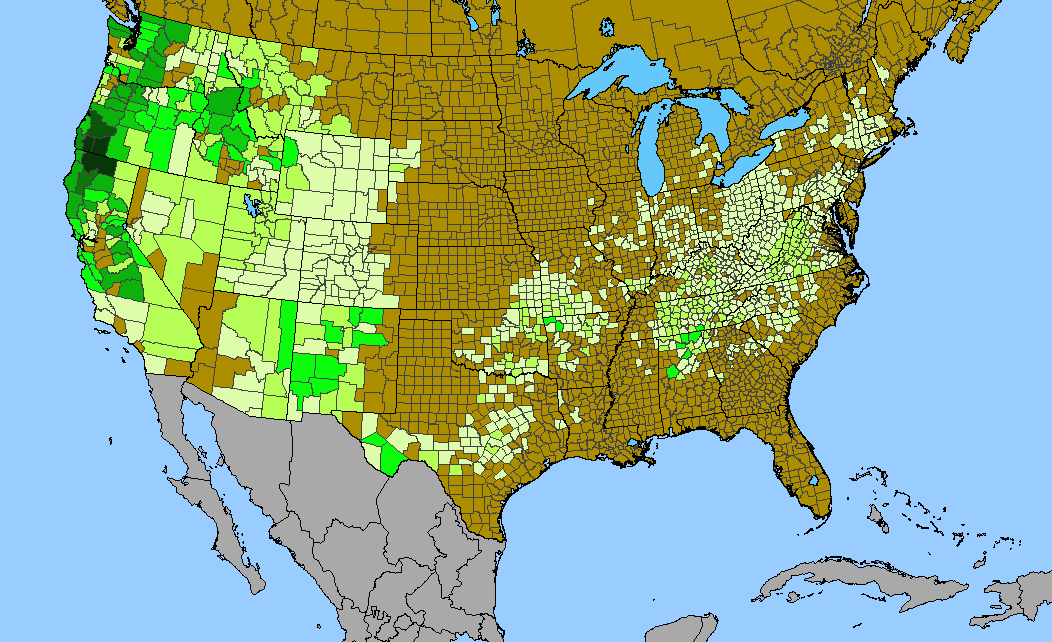
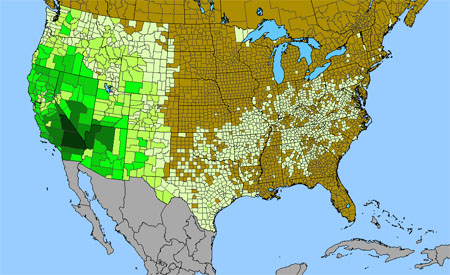
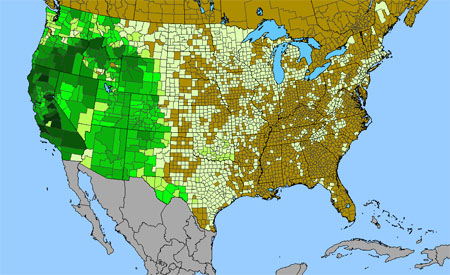
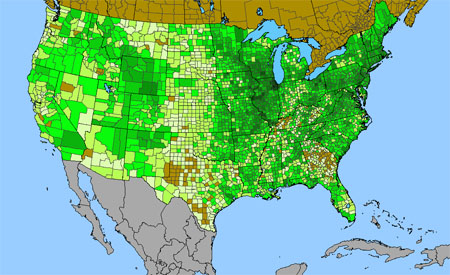
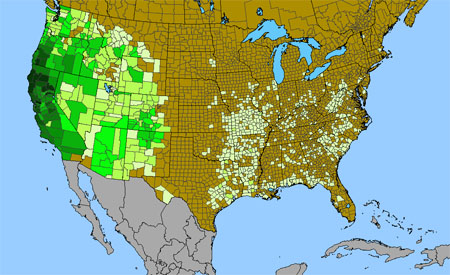
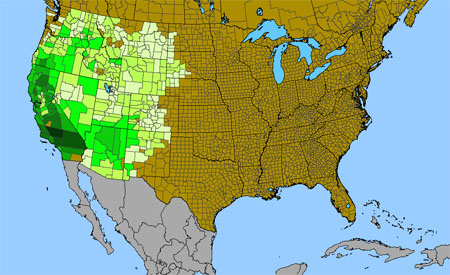
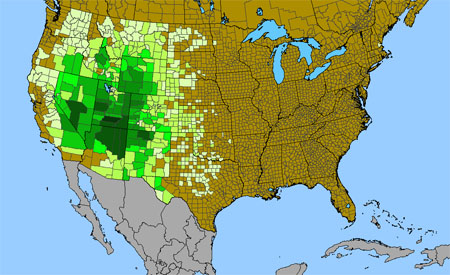
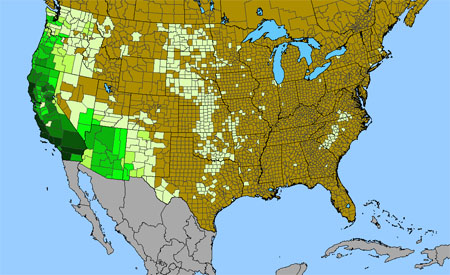
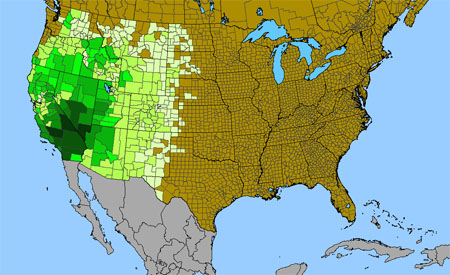
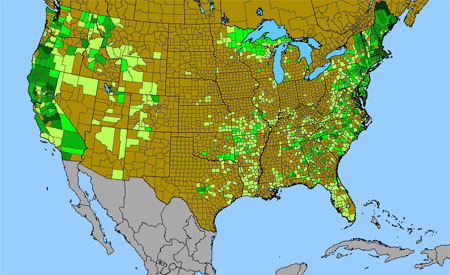
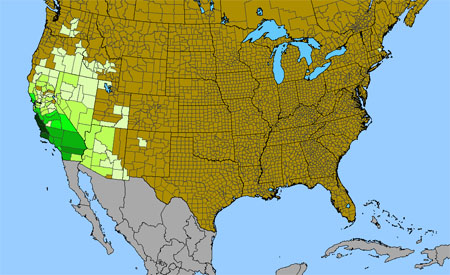
Density gradient of native species for Penstemon within the US (data 2011). Darkest green (31 spp. Garfield County, UT) indicates the highest species concentration. ©BONAP |
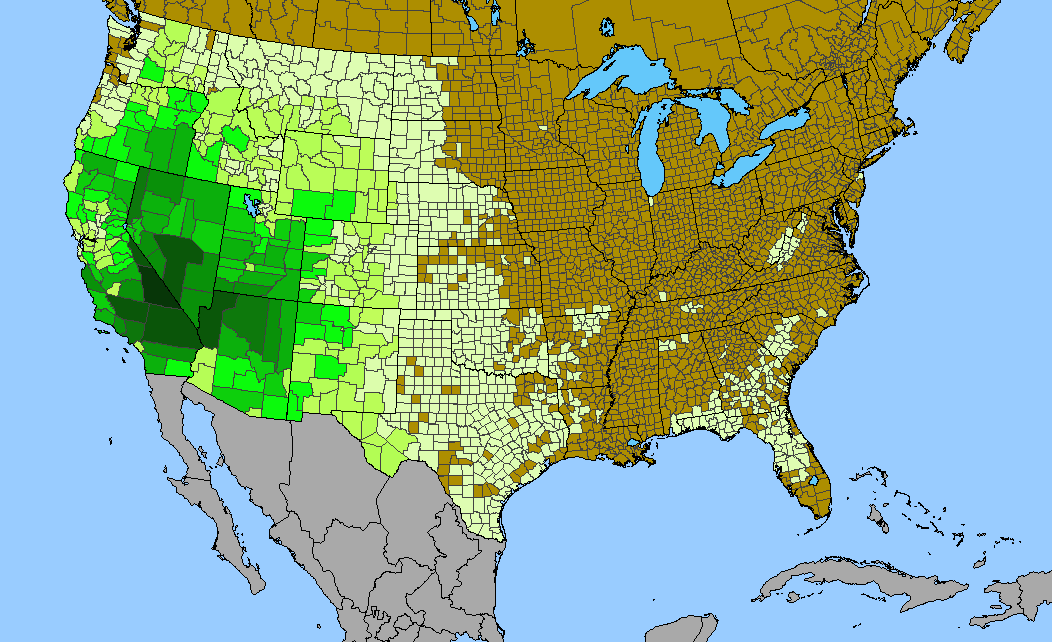
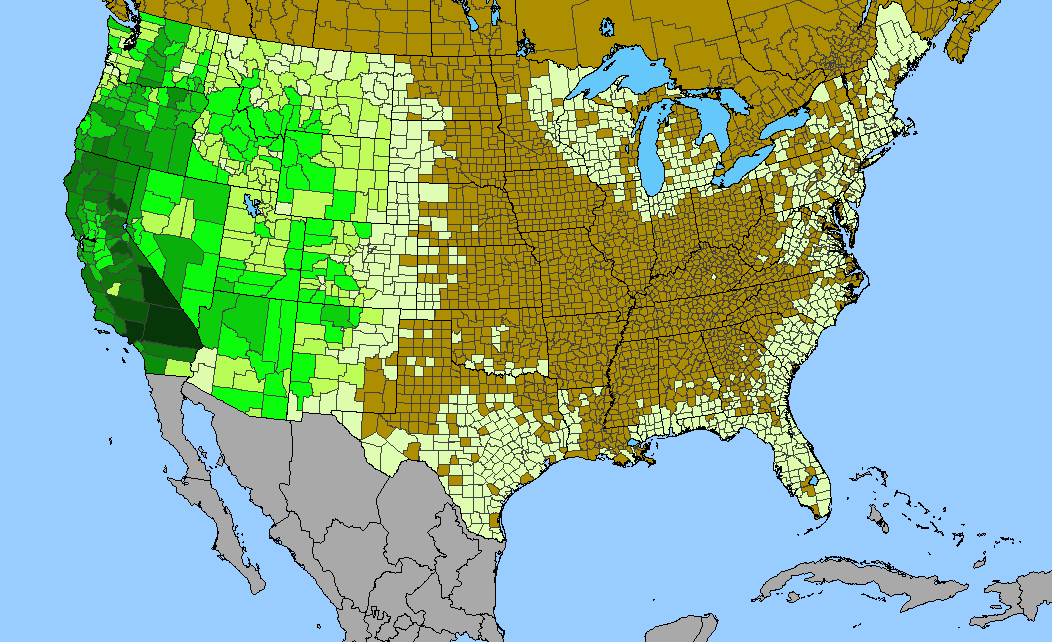
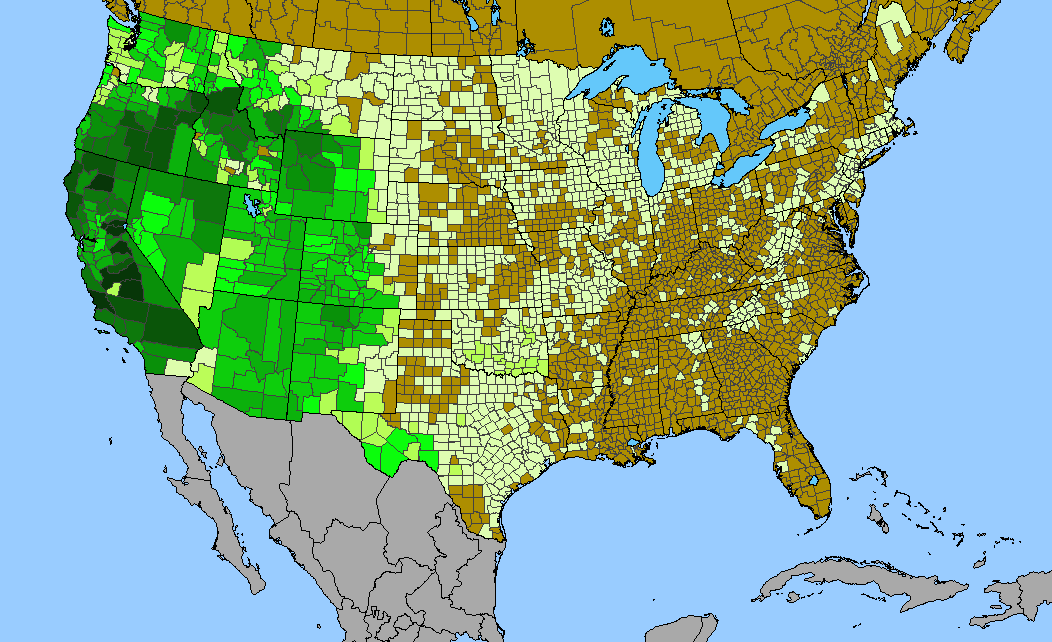
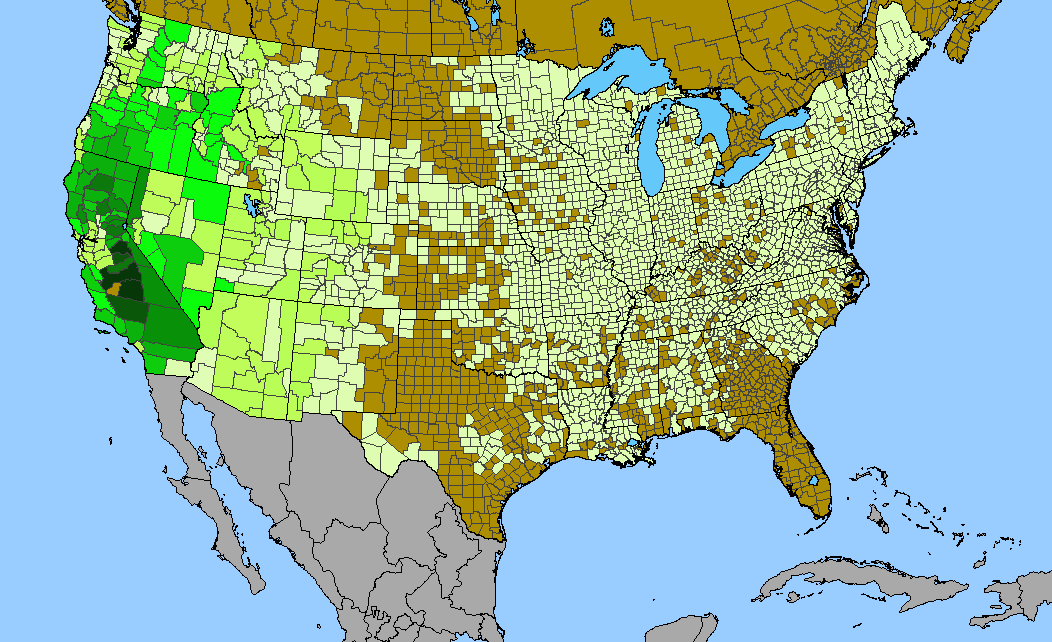
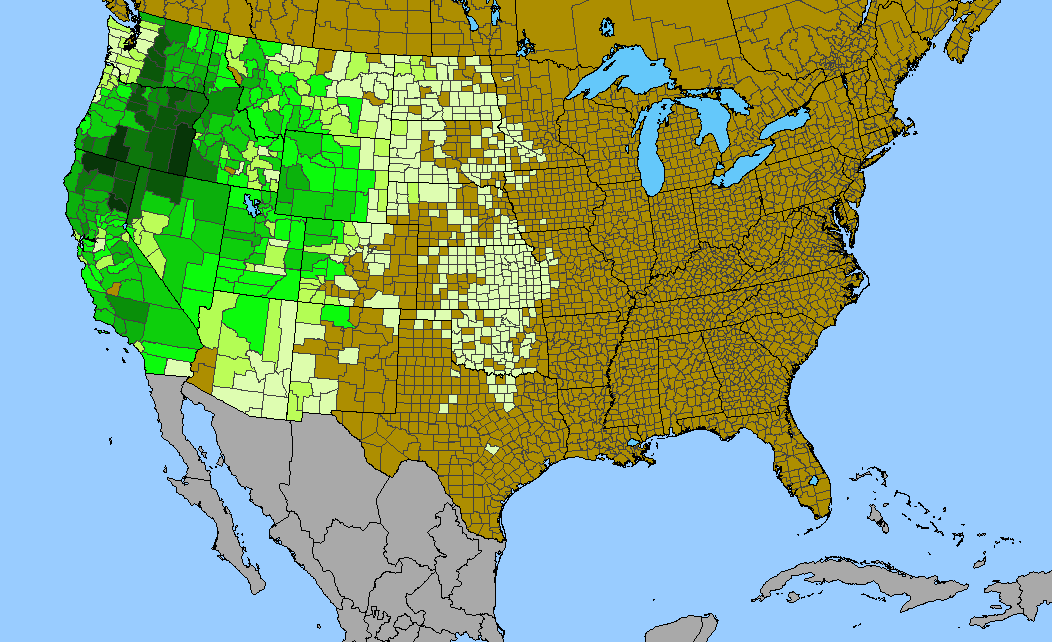
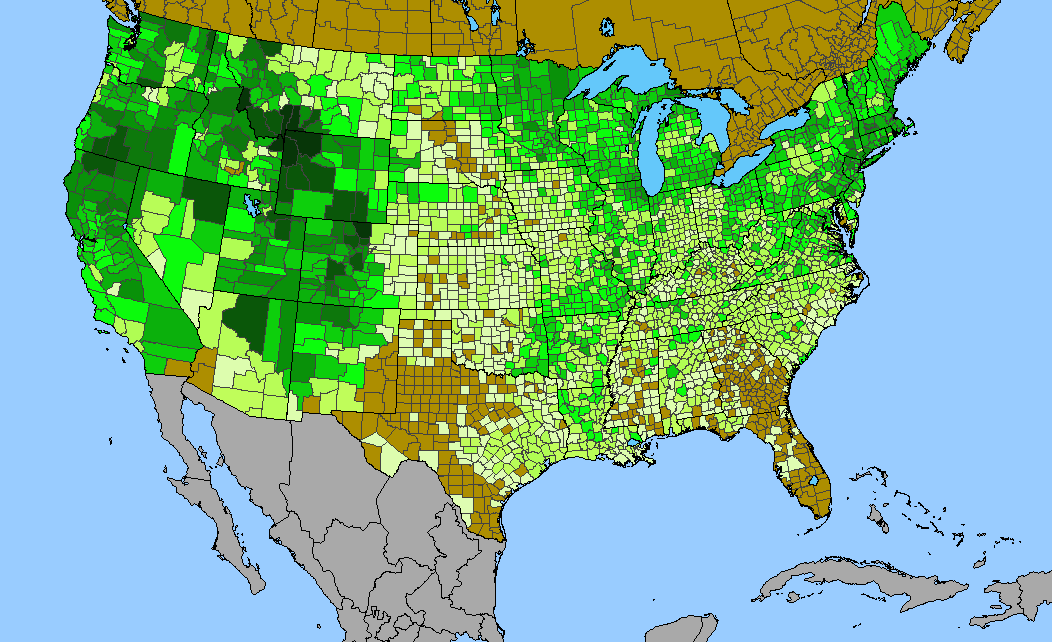
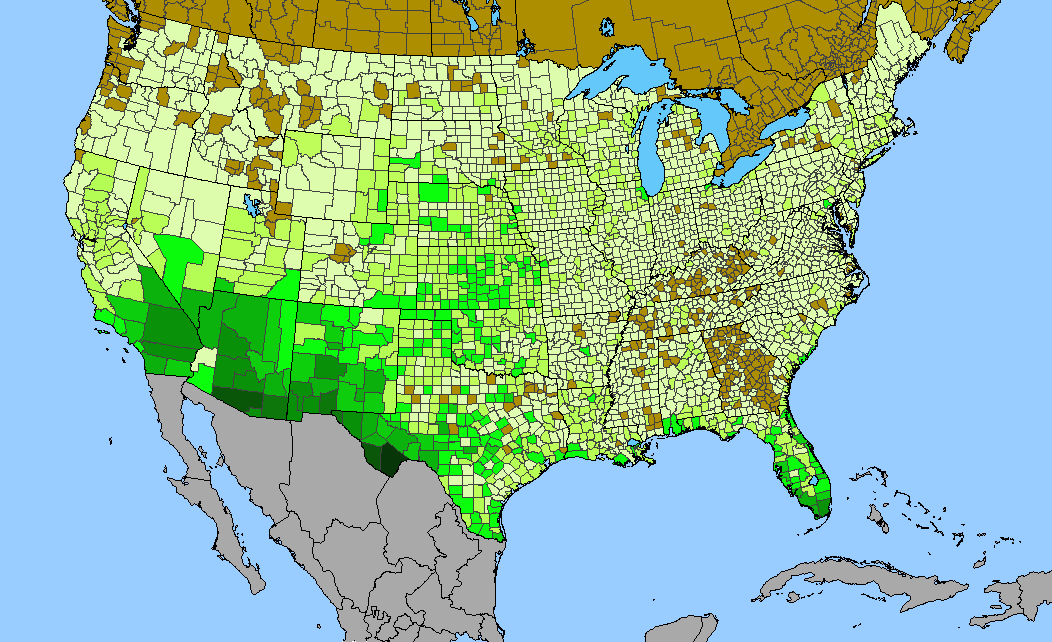
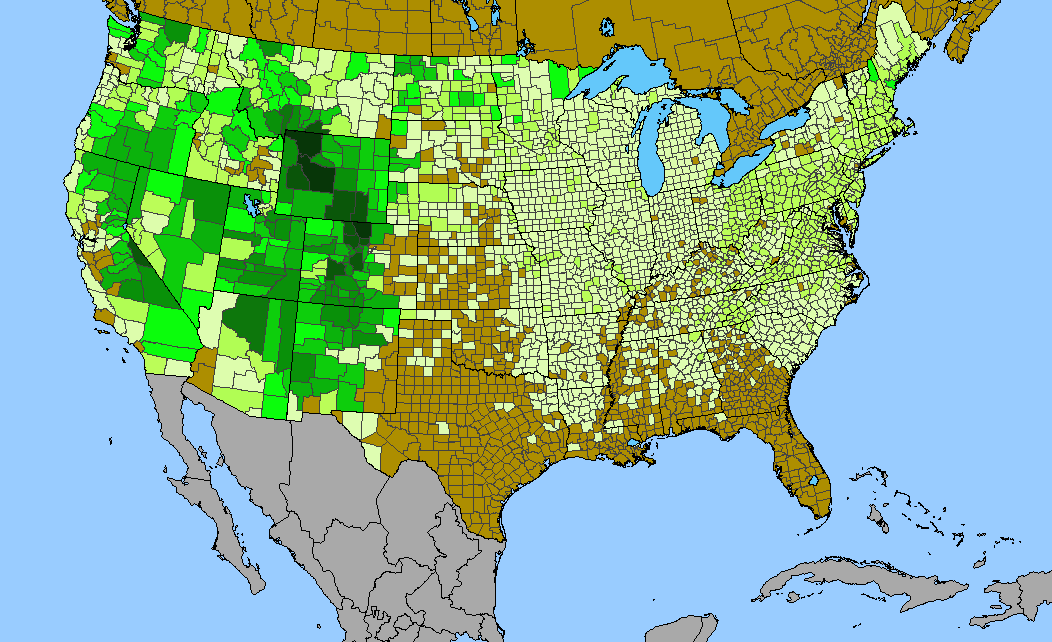
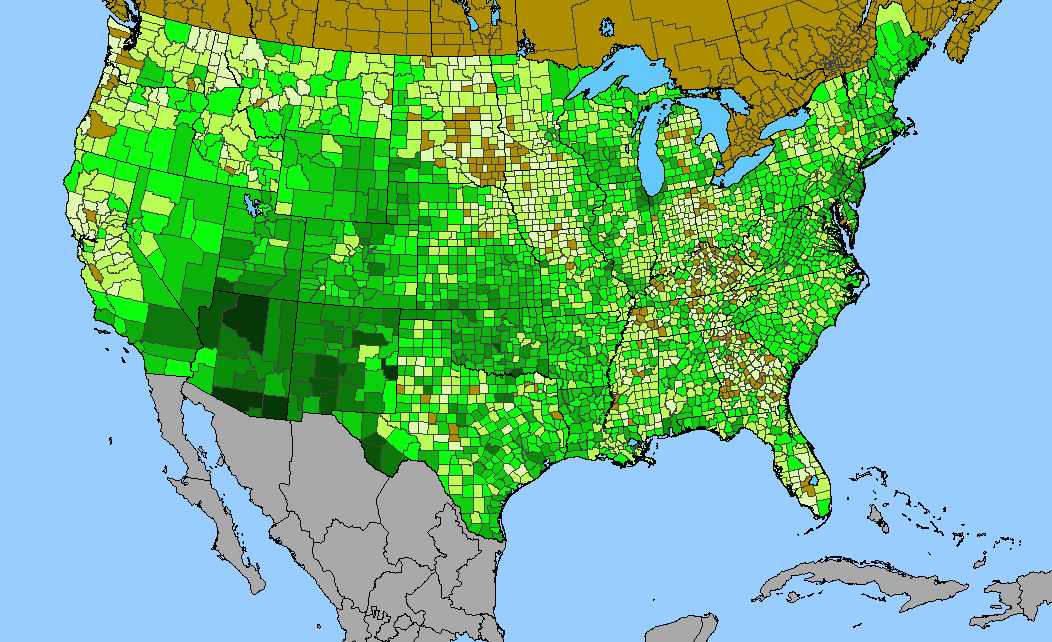
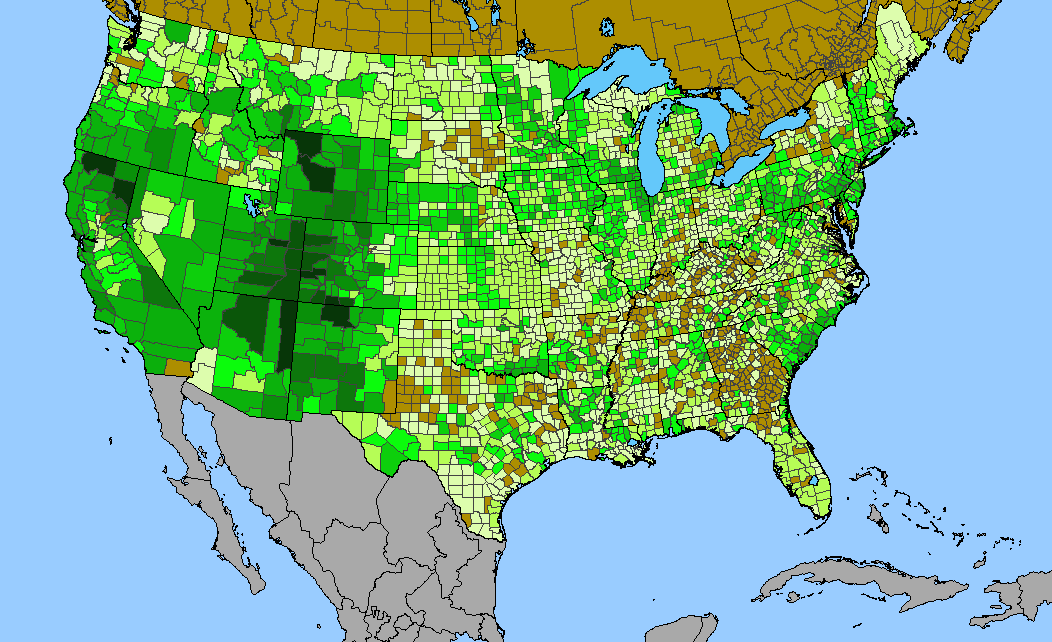
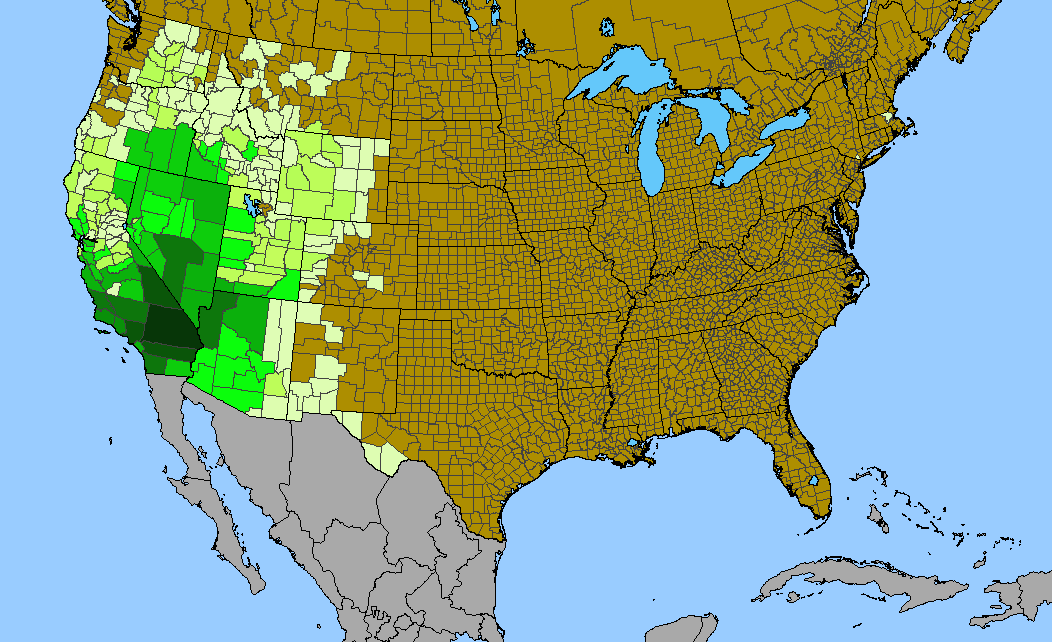
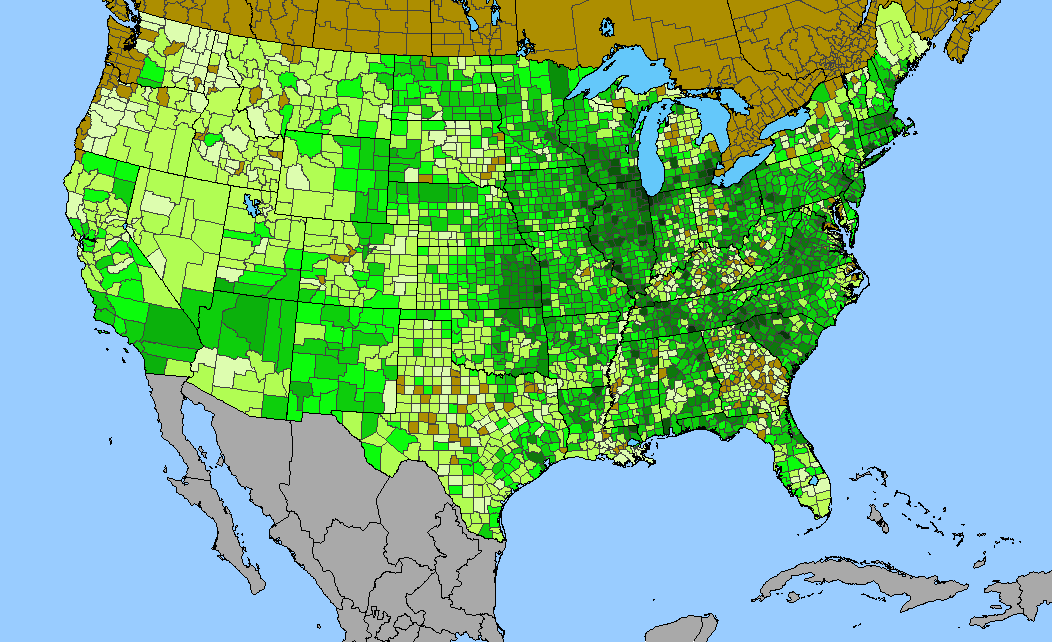
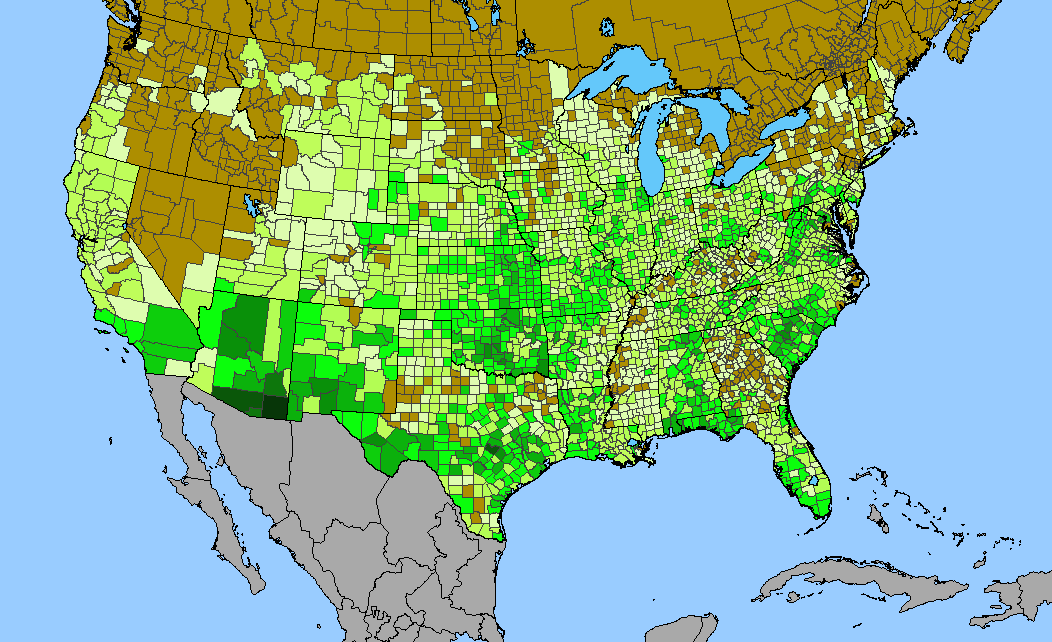
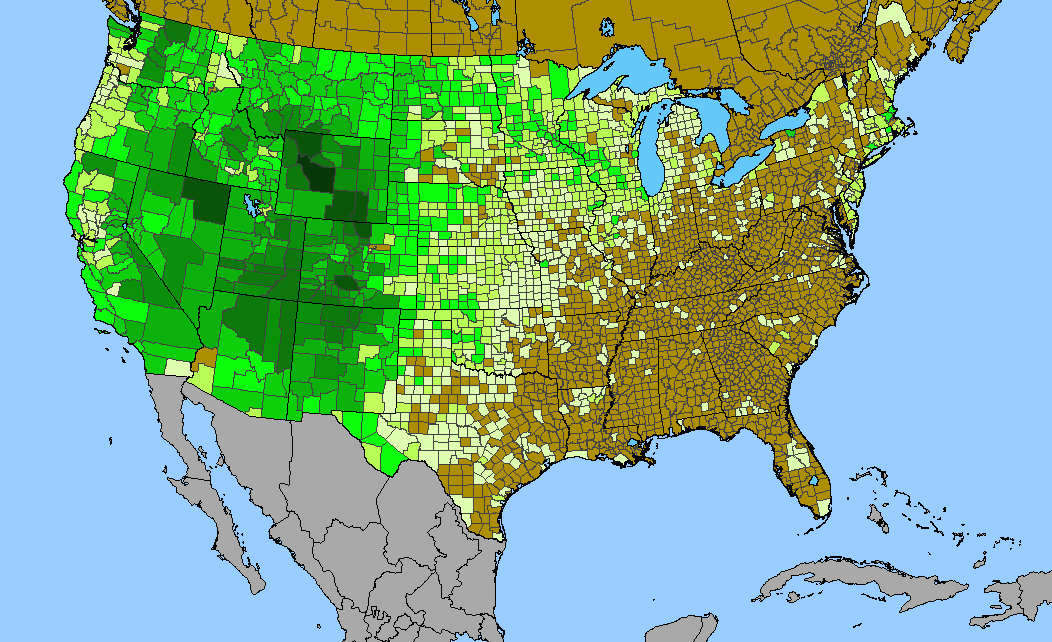
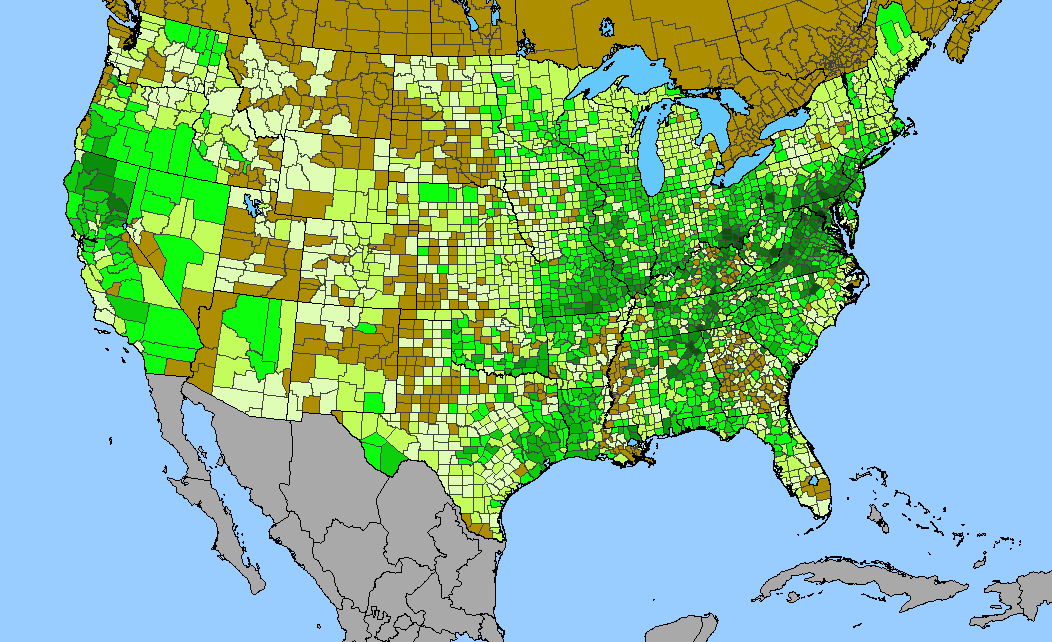
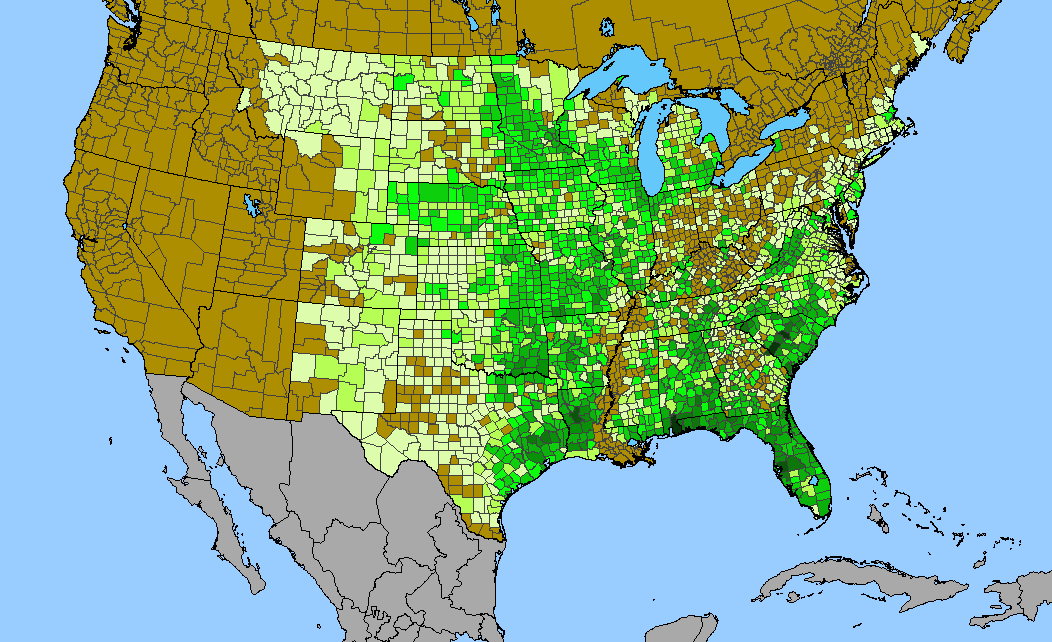
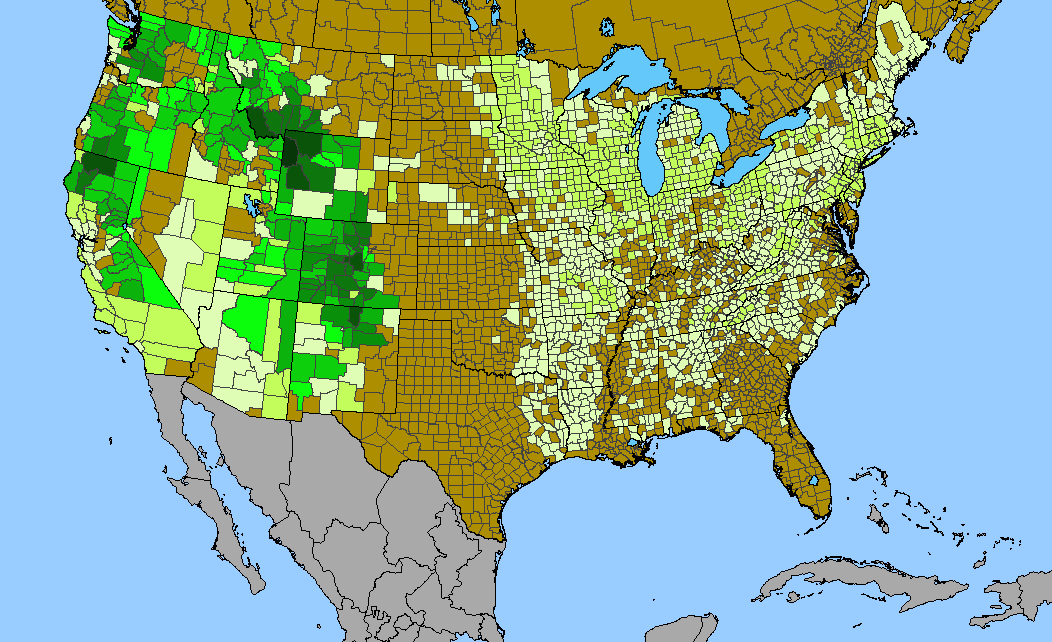
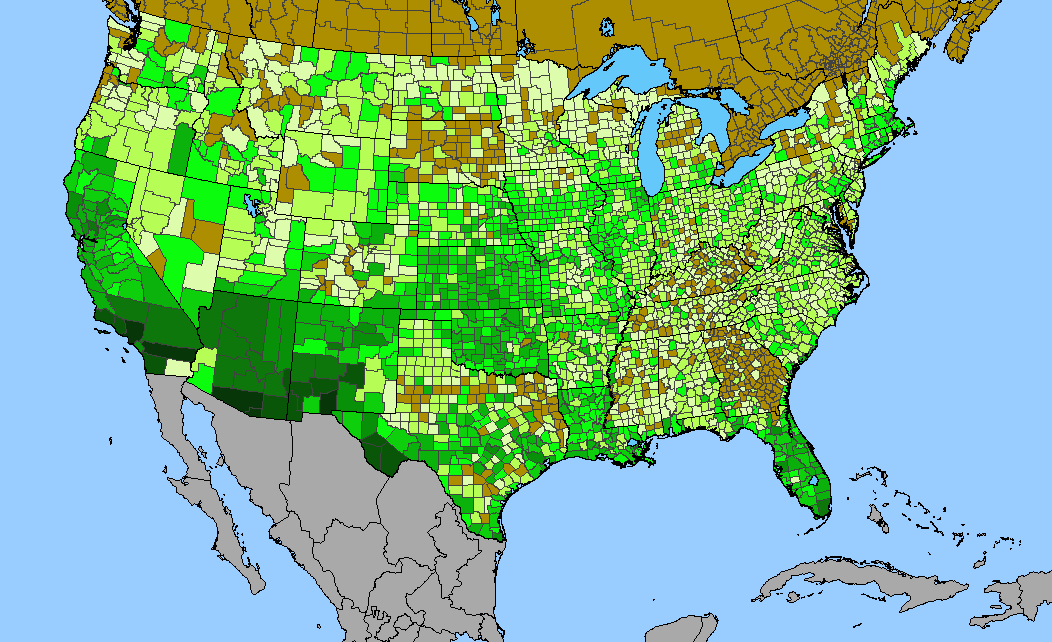
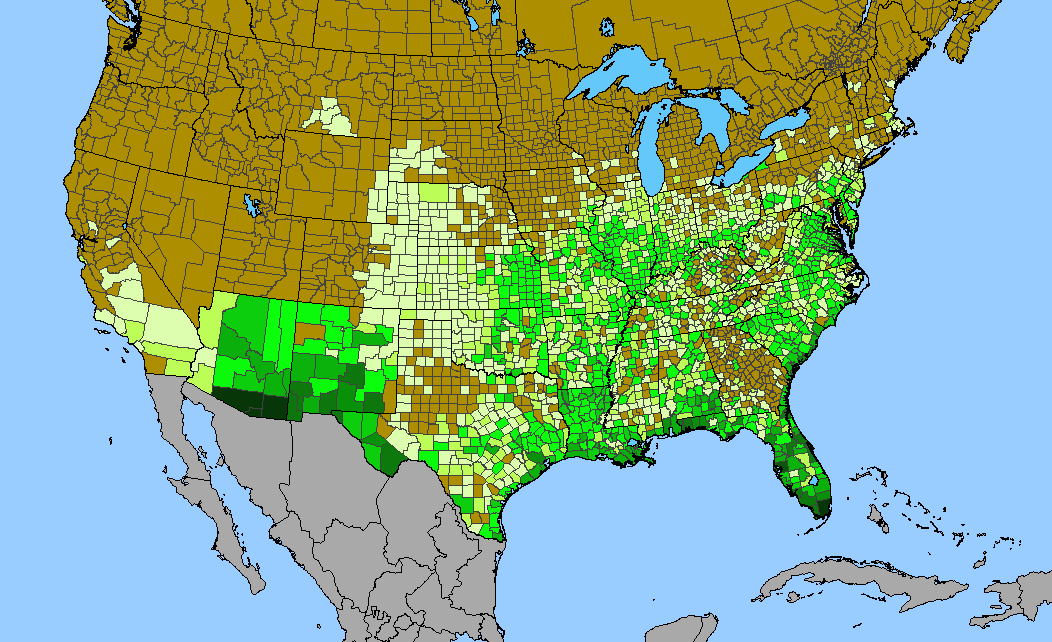
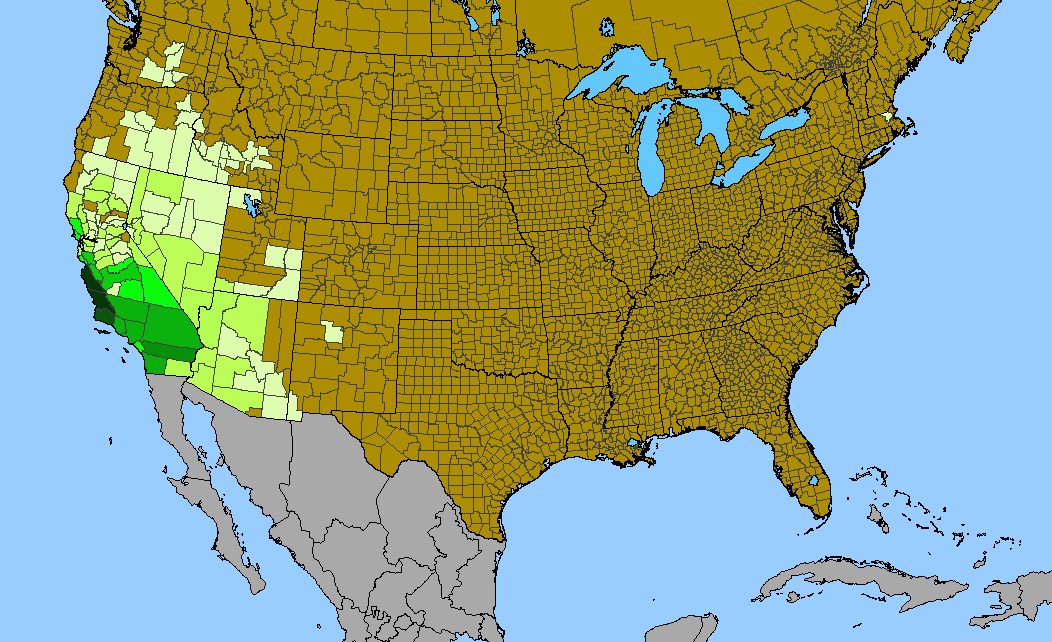
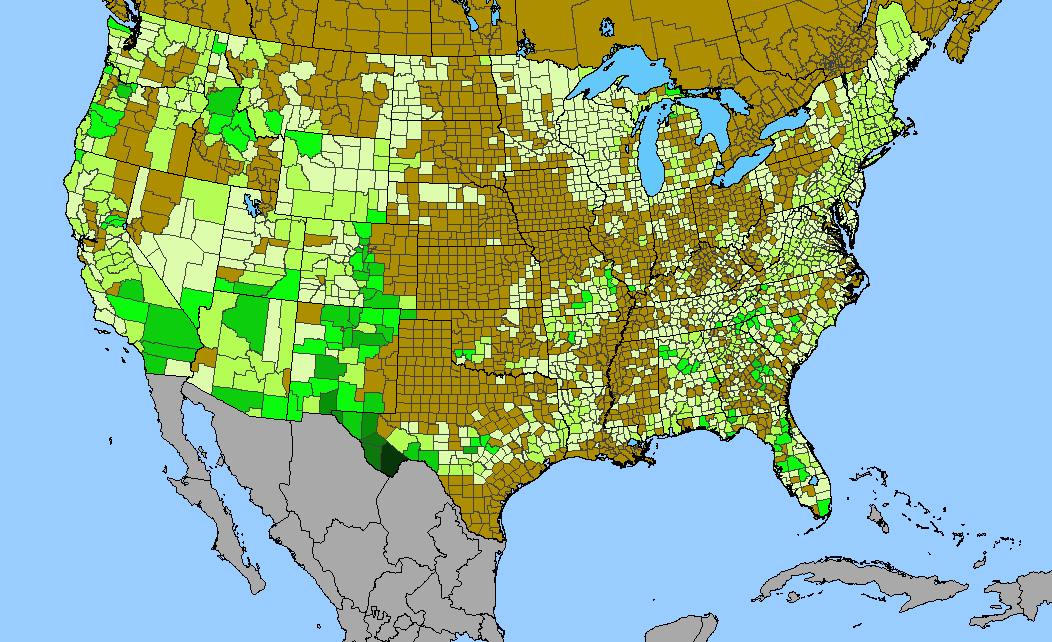
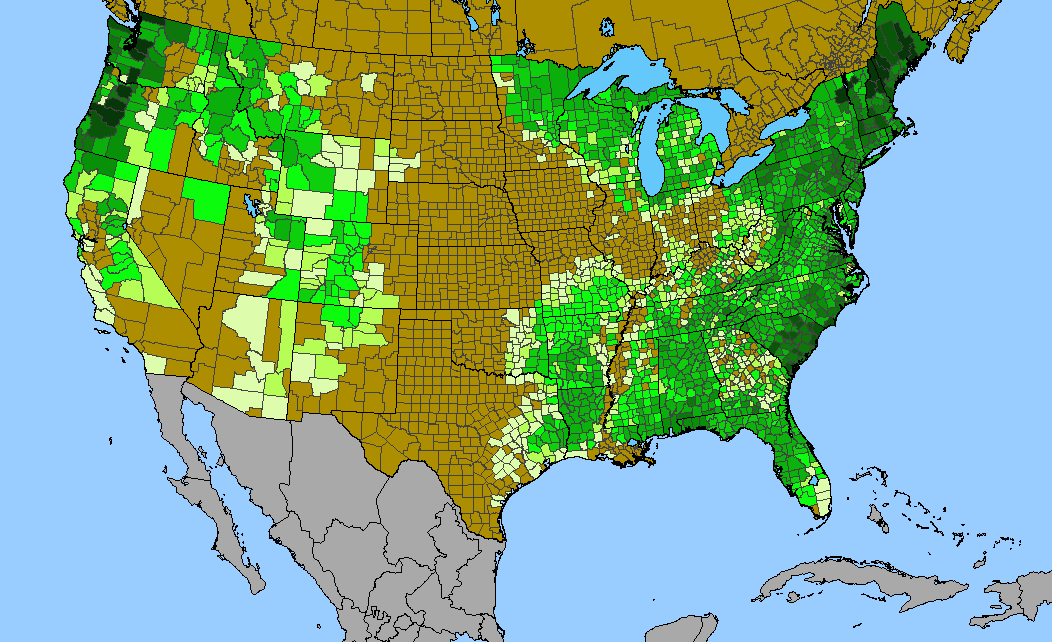
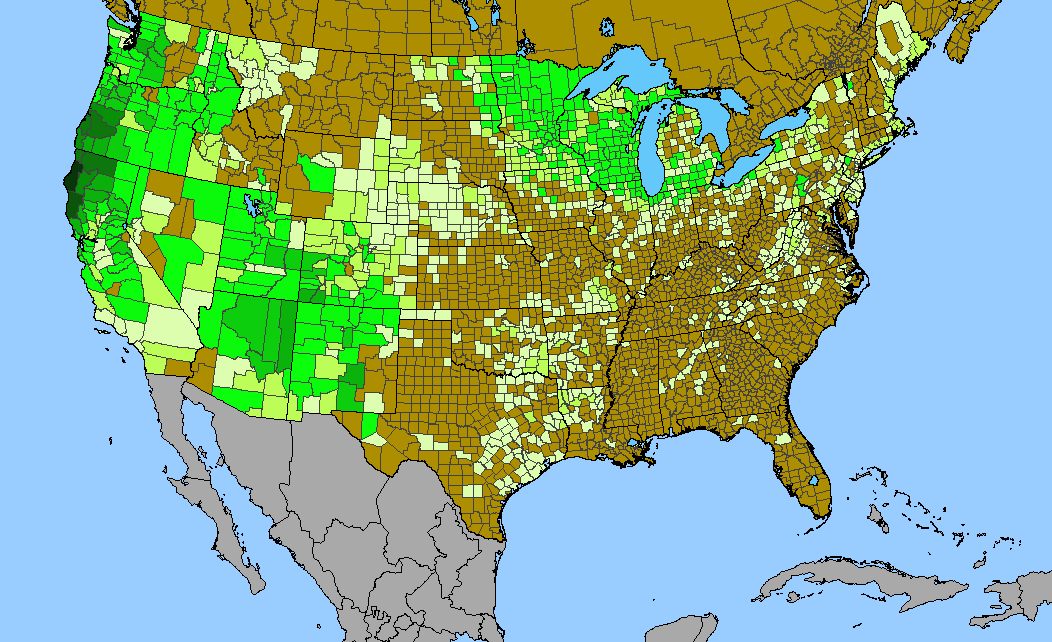
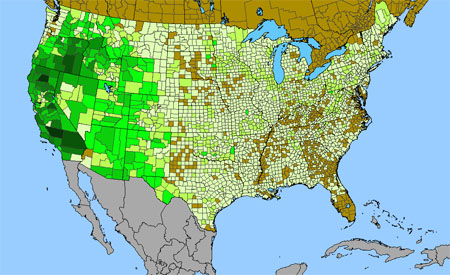
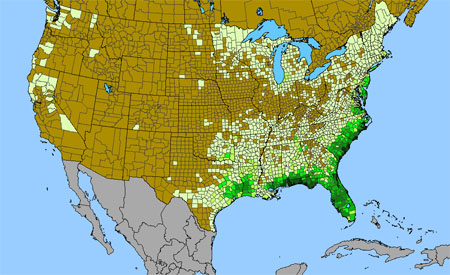
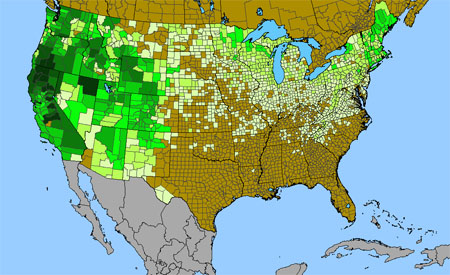
 Density gradient of native species for Eriogonum within the US (data 2011). Darkest green (55 spp. Inyo County, CA) indicates the highest species concentration. ©BONAP | 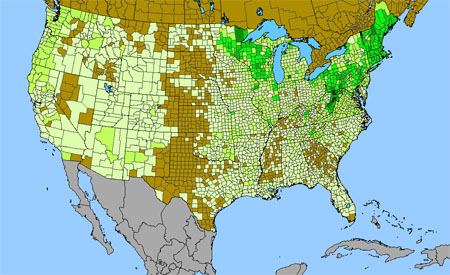
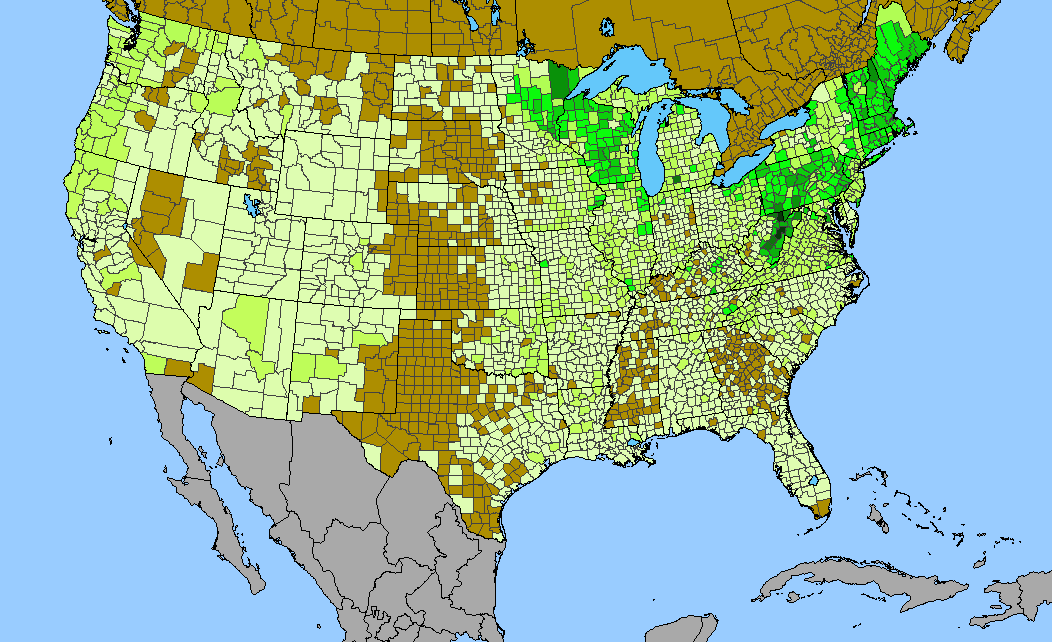
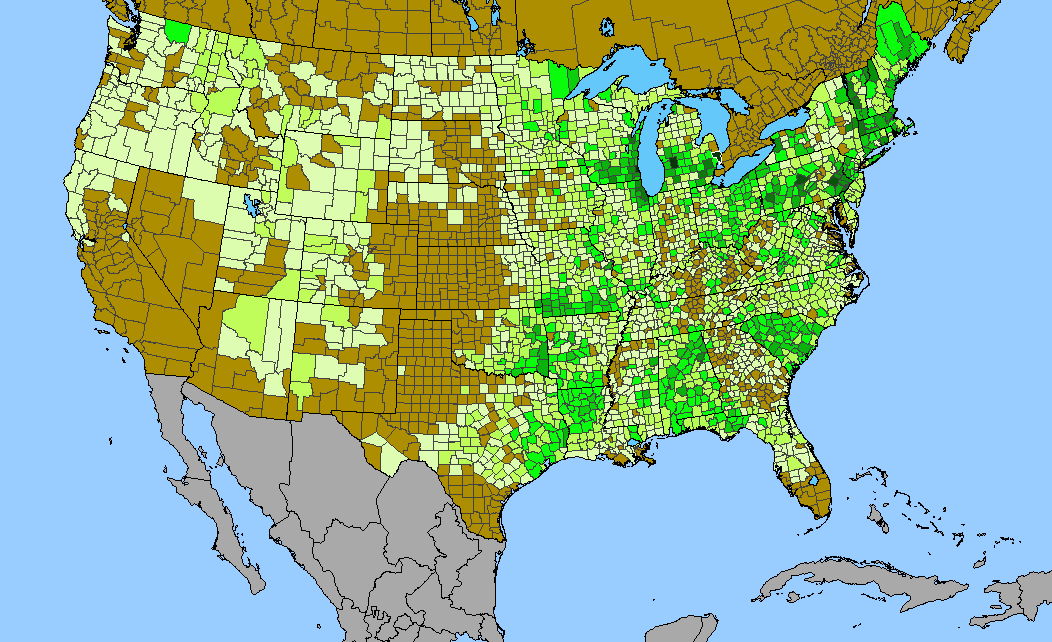
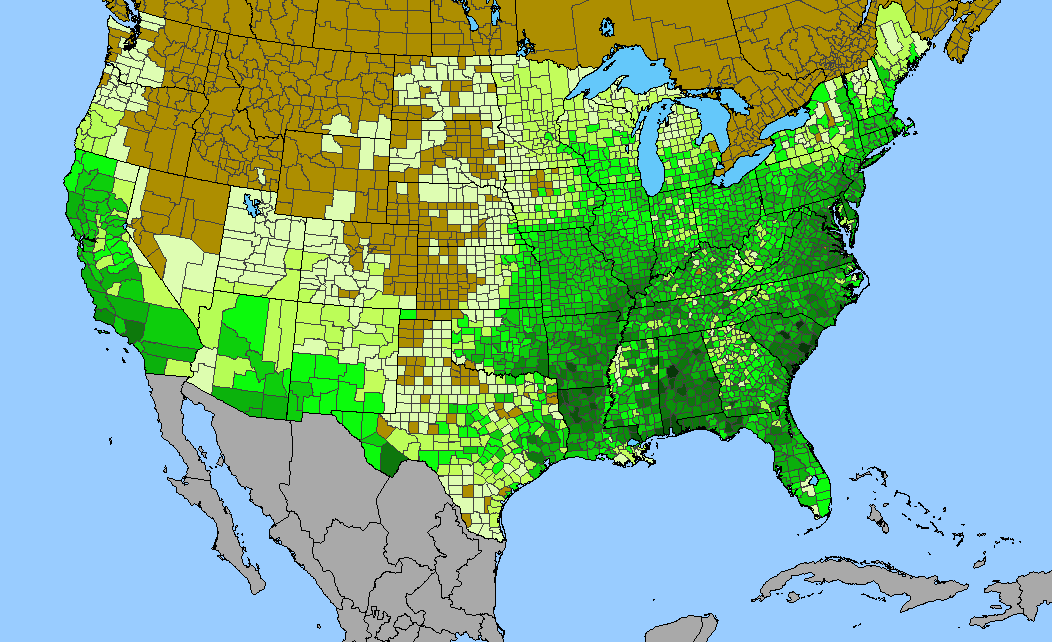
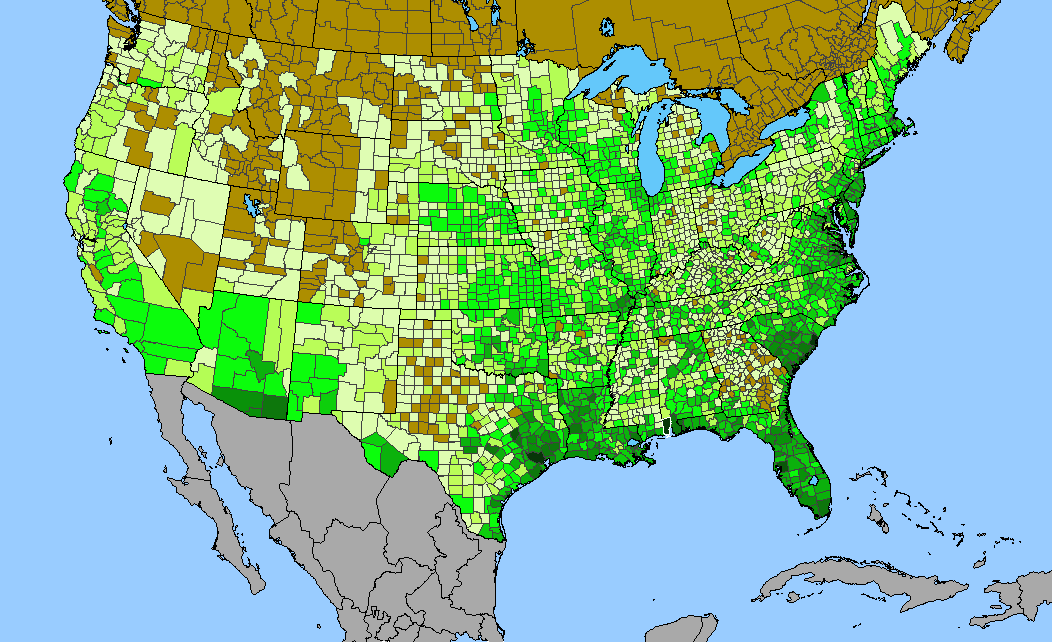
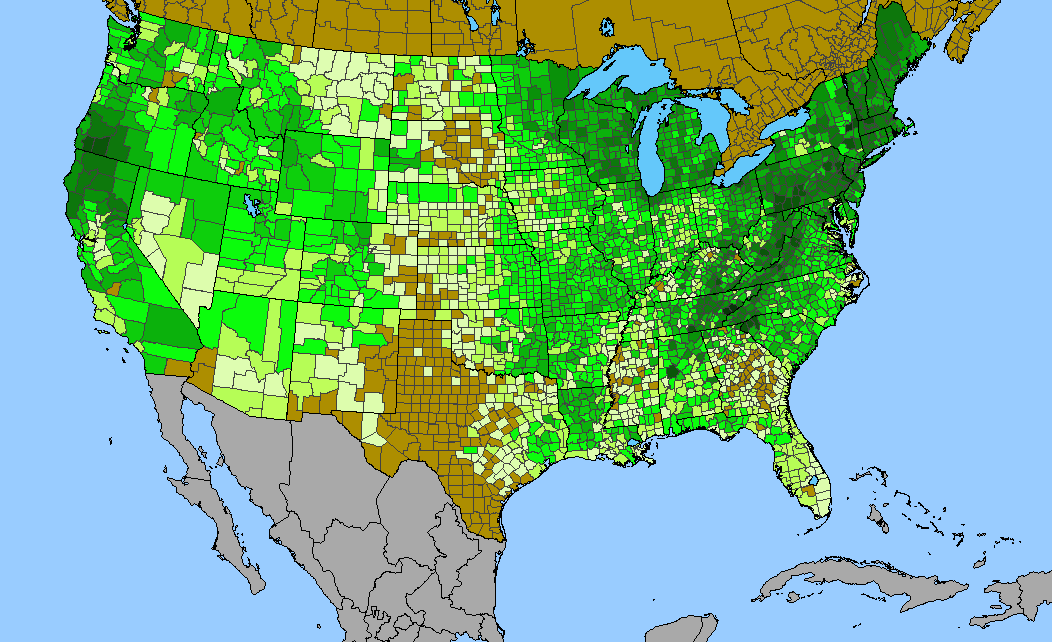
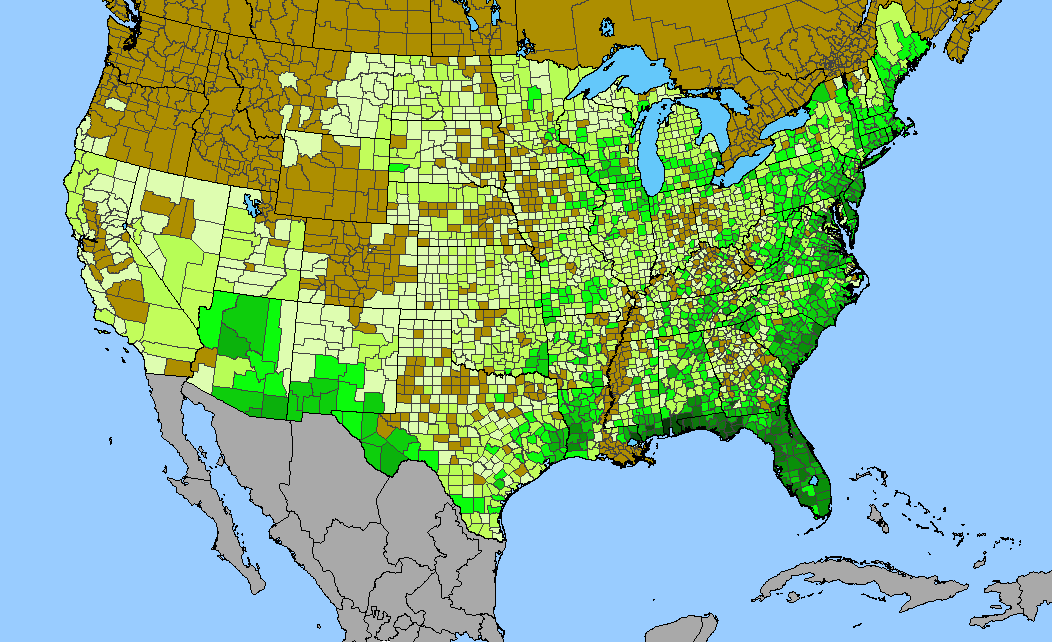
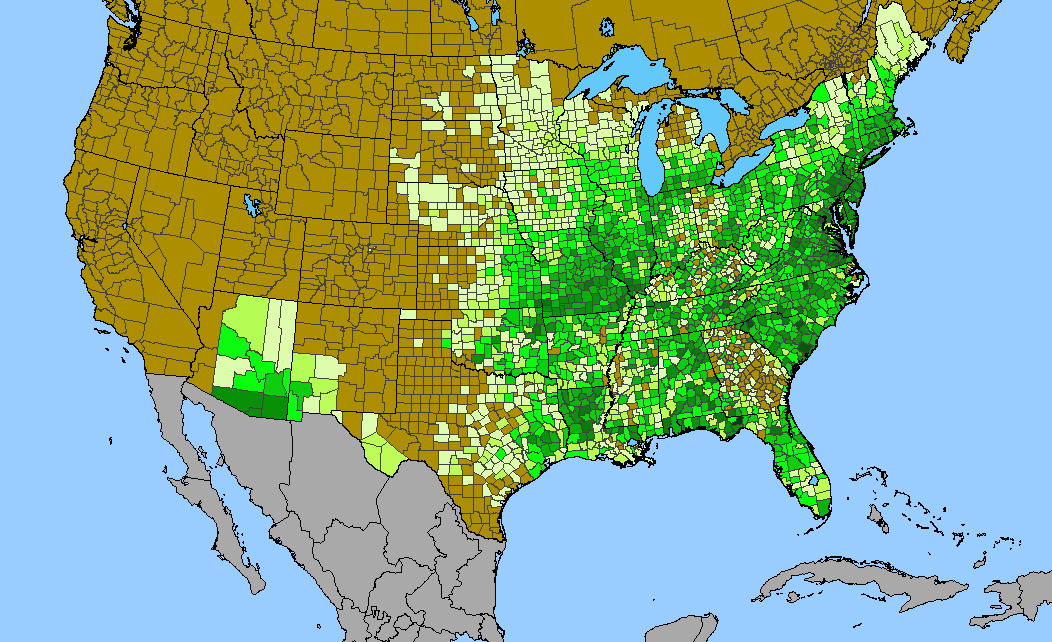
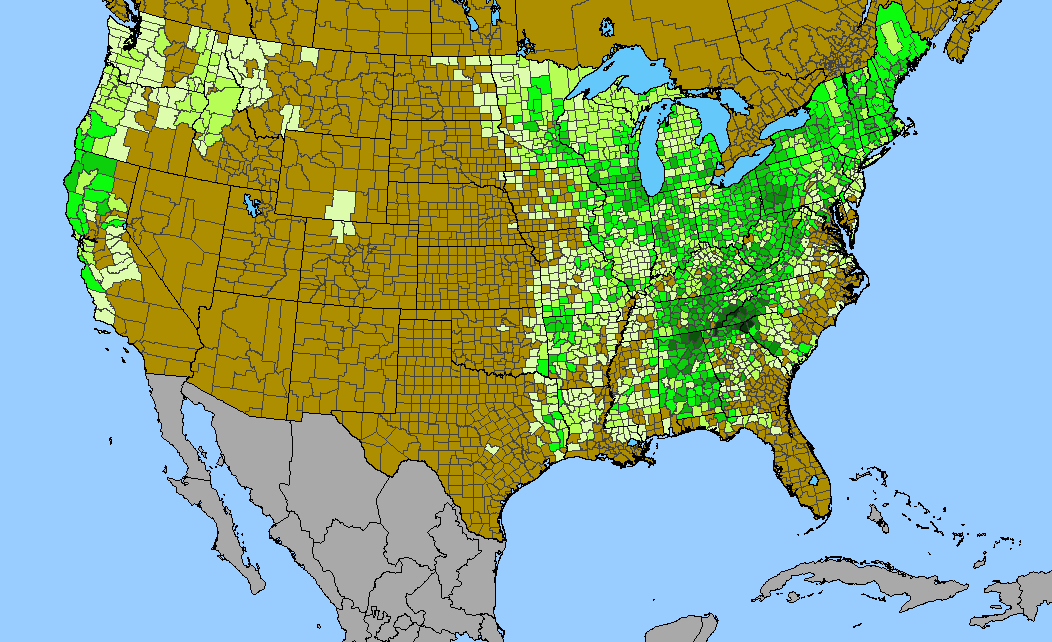
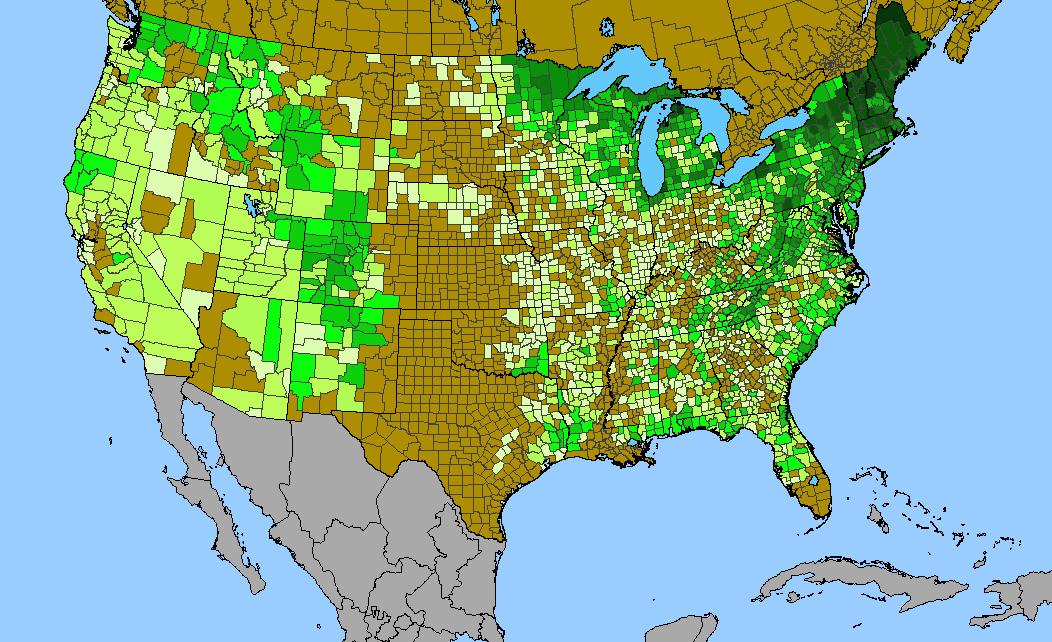
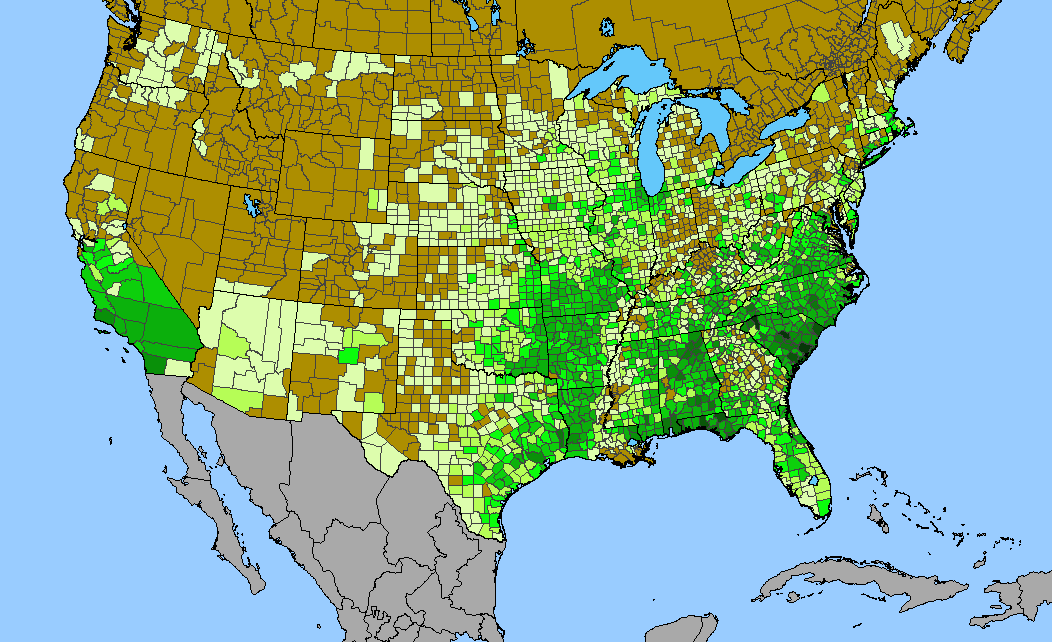
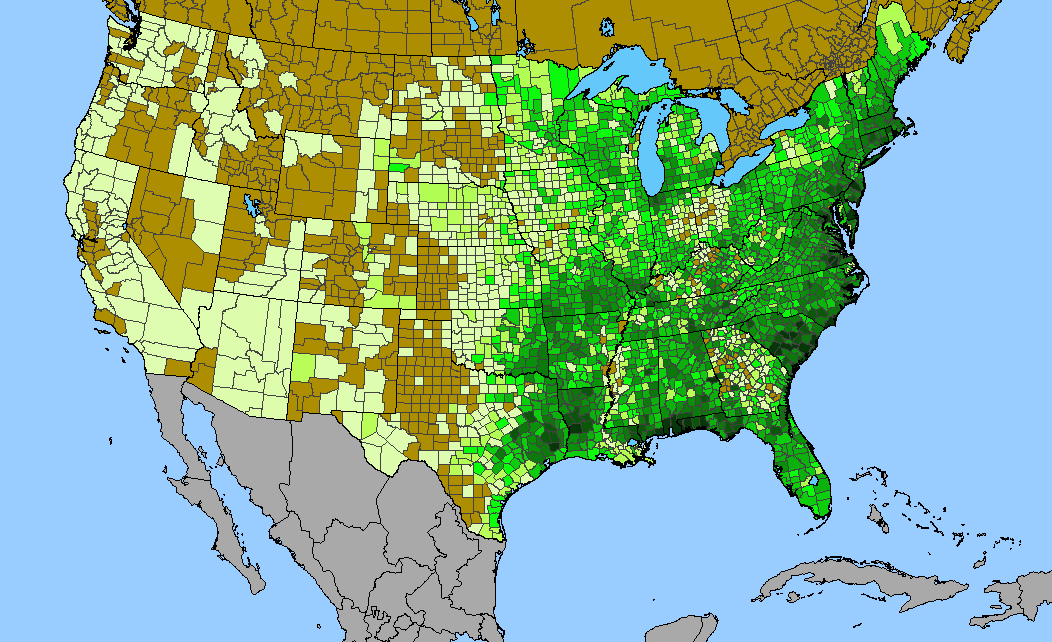
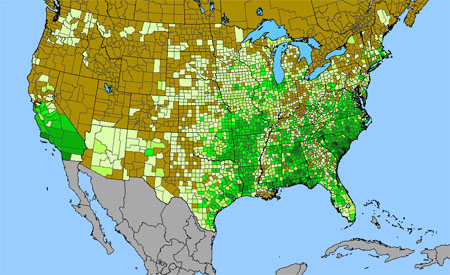
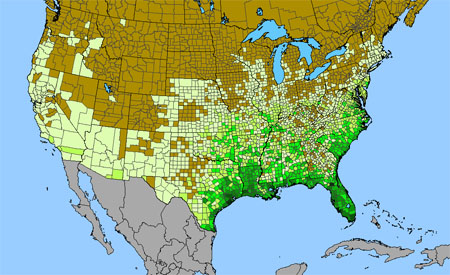
Density gradient of native species for Rubus within the US (data 2011). Darkest green (43 spp. Preston County, WV) indicates the highest species concentration. ©BONAP | 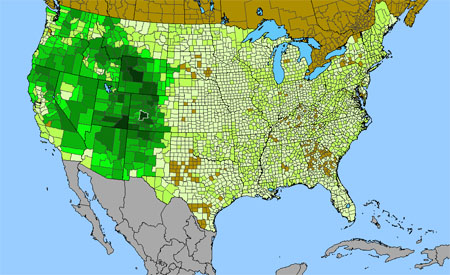
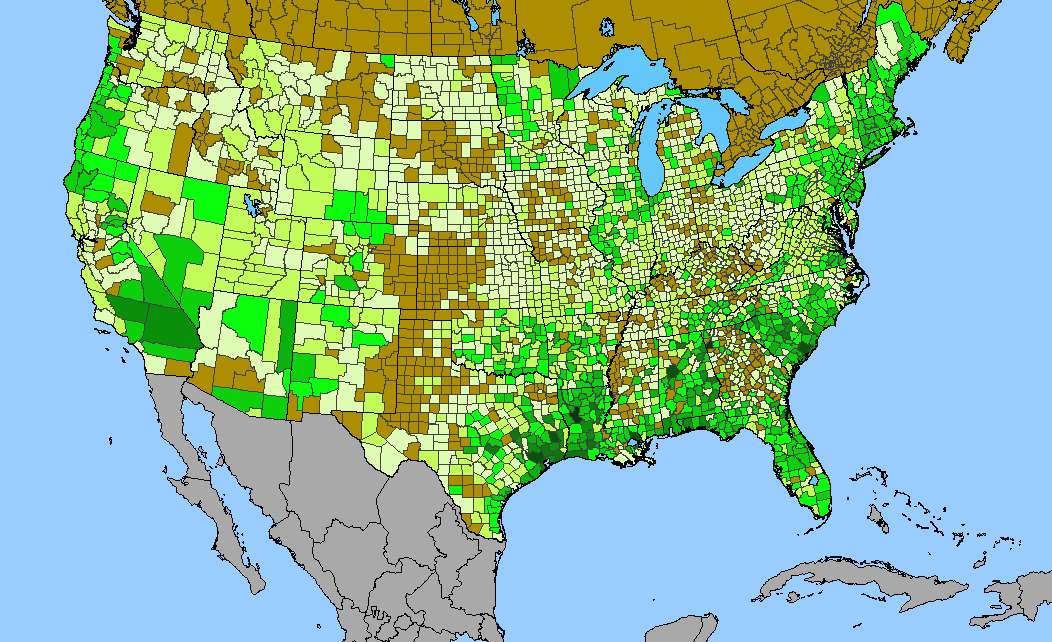
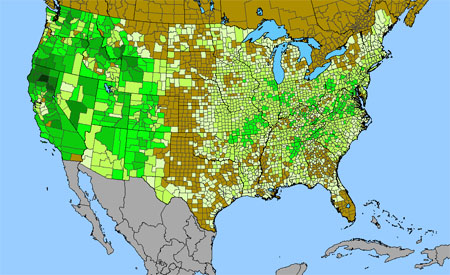
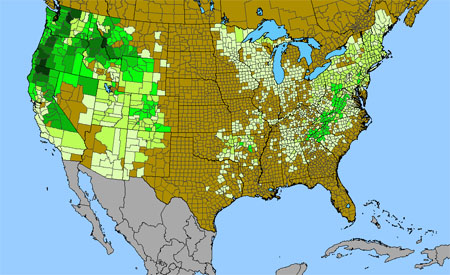
Density gradient of native species for Erigeron within the US (data 2011). Darkest green (34 spp. Gunnison County, CO) indicates the highest species concentration. ©BONAP |
 Density gradient of native species for Phacelia within the US (data 2011). Darkest green (43 spp. Inyo County, CA) indicates the highest species concentration. ©BONAP | 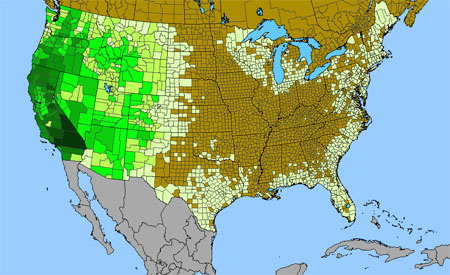 Density gradient of native species for Lupinus within the US (data 2011). Darkest green (39 spp. Inyo County, CA) indicates the highest species concentration. ©BONAP | 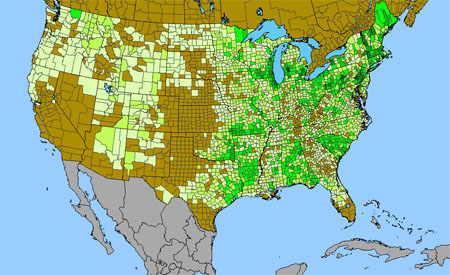
Density gradient of native species for Cratageus within the US (data 2011). Darkest green (24 spp. Kent County, MI; St. Clair County, MI) indicates the highest species concentration. ©BONAP |
 Density gradient of native species for Cryptantha within the US (data 2011). Darkest green (39 spp. Inyo County, CA) indicates the highest species concentration. ©BONAP | 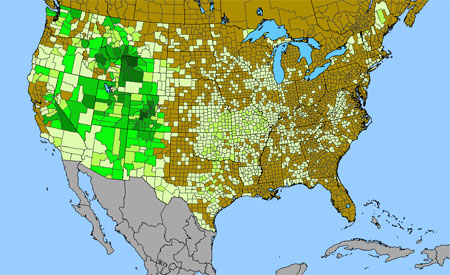 Density gradient of native species for Draba within the US (data 2011). Darkest green (19 spp. Gunnison County, CO) indicates the highest species concentration. ©BONAP | 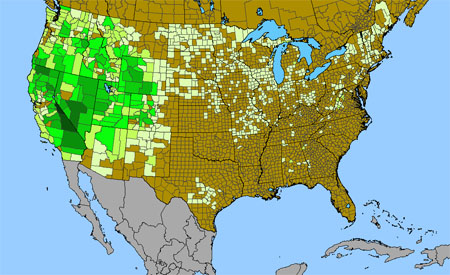 Density gradient of native species for Boechera within the US (data 2011). Darkest green (17 spp. Mono County, CA) indicates the highest species concentration. ©BONAP |
Density gradient of native species for Castilleja within the US (data 2011). Darkest green (19 spp. Fresno County, CA; Tuolumne County, CA) indicates the highest species concentration. ©BONAP | 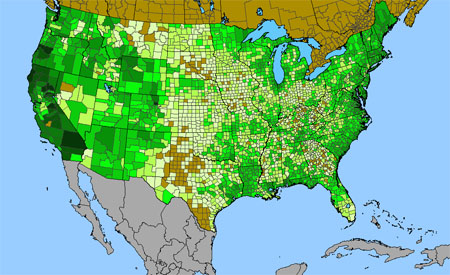 Density gradient of native species for Juncus within the US (data 2011). Darkest green (32 spp. Plumas County, CA) indicates the highest species concentration. ©BONAP | 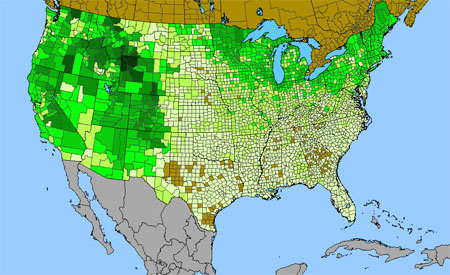 Density gradient of native species for Salix within the US (data 2011). Darkest green (30 spp. Park County, WY) indicates the highest species concentration. ©BONAP |
 Density gradient of native speciesfor Quercus within the US (data 2011). Darkest green (26 spp. Berkeley County, SC; Tuscaloosa County AL) indicates the highest species concentration. ©BONAP | 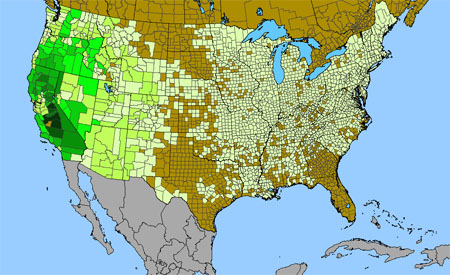 Density gradient of native species for Mimulus within the US (data 2011). Darkest green (36 spp. Tulare County, CA) indicates the highest species concentration. ©BONAP | 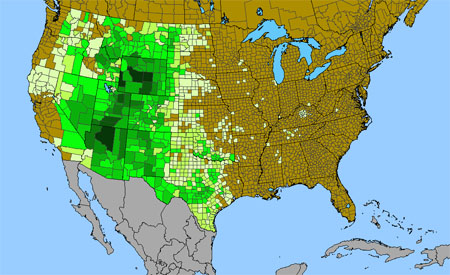 Density gradient of native species for Physaria within the US (data 2011). Darkest green (13 spp. Coconino County, AZ) indicates the highest species concentration. ©BONAP |
 Density gradient of native species for Allium within the US (data 2011). Darkest green (18 spp. Shasta County, CA) indicates the highest species concentration. ©BONAP | 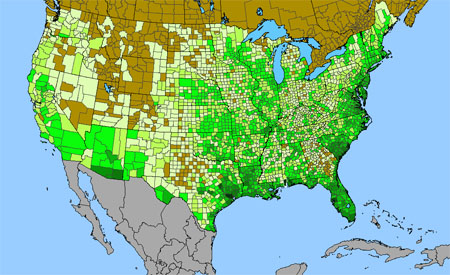 Density gradient of native species for Cyperus within the US (data 2011). Darkest green (31 spp. Mobile County, AL) indicates the highest species concentration. ©BONAP | 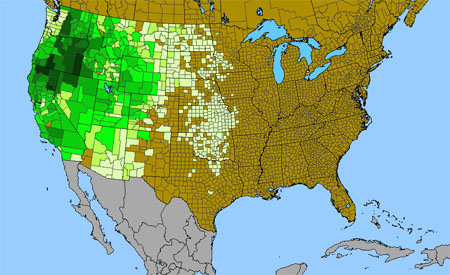 Density gradient of native species for Lomatium within the US (data 2011). Darkest green (20 spp. Malheur County, OR) indicates the highest species concentration. ©BONAP |
 Density gradient of native species for Symphyotrichum within the US (data 2011). Darkest green (24 spp. Cook County, IL) indicates the highest species concentration. ©BONAP | 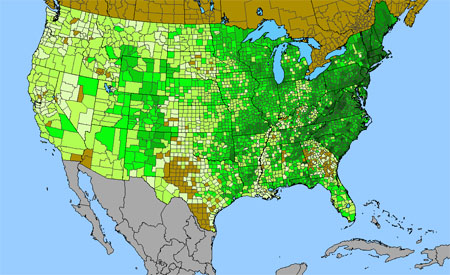 Density gradient of native species for Solidago within the US (data 2011). Darkest green (23 spp. Fayette County, VA) indicates the highest species concentration. ©BONAP | 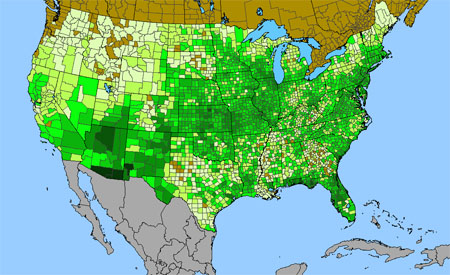 Density gradient of native species for Asclepias within the US (data 2011). Darkest green (18 spp. Cochise County, AZ; Pima County, AZ; Grant County, NM) indicates the highest species concentration. ©BONAP |
 Density gradient of native species for Ranunculus within the US (data 2011). Darkest green (23 spp. Park County, WY; Teton County, WY) indicates the highest species concentration. ©BONAP | 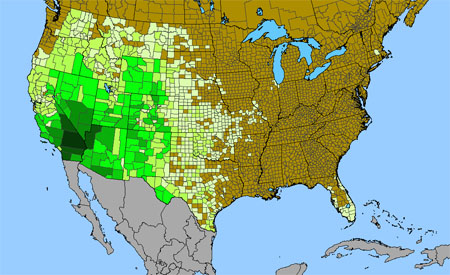 Density gradient of native species for Mentzelia within the US (data 2011). Darkest green (24 spp. San Bernardino County, CA) indicates the highest species concentration. ©BONAP | 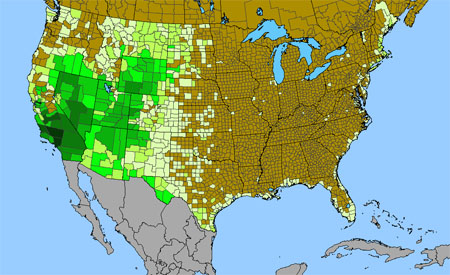 Density gradient of native species for Atriplex within the US (data 2011). Darkest green (23 spp. Kern County, CA) indicates the highest species concentration. ©BONAP |
 Density gradient of native species for Chamaesyce within the US (data 2011). Darkest green (30 spp. Brewster County, TX) indicates the highest species concentration. ©BONAP | 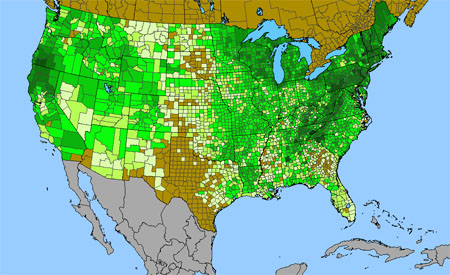 Density gradient of native species for Viola within the US (data 2011). Darkest green (22 spp. Sevier County, TN) indicates the highest species concentration. ©BONAP | 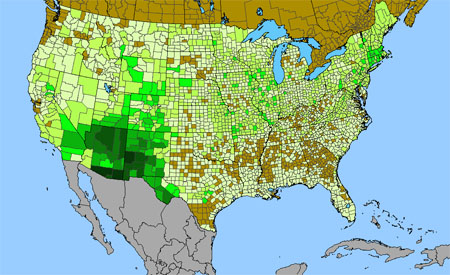 Density gradient of native species for Muhlenbergia within the US (data 2011). Darkest green (33 spp. Cochise County, AZ; Catron County, NM) indicates the highest species concentration. ©BONAP |
 Density gradient of native species for Rhynchospora within the US (data 2011). Darkest green (46 spp. Baldwin County, AL) indicates the highest species concentration. ©BONAP | 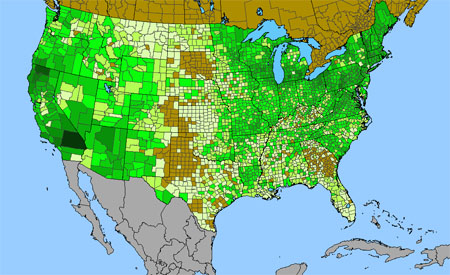 Density gradient of native species for Galium within the US (data 2011). Darkest green (20 spp. San Bernardino County, CA) indicates the highest species concentration. ©BONAP | 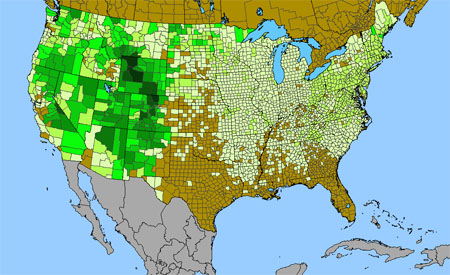 Density gradient of native species for Potentilla within the US (data 2011). Darkest green (19 spp. Fremont County, WY; Park County, WY) indicates the highest species concentration. ©BONAP |
 Density gradient of native species for Trifolium within the US (data 2011). Darkest green (23 spp. Humboldt County, CA; Plumas County, CA) indicates the highest species concentration. ©BONAP | 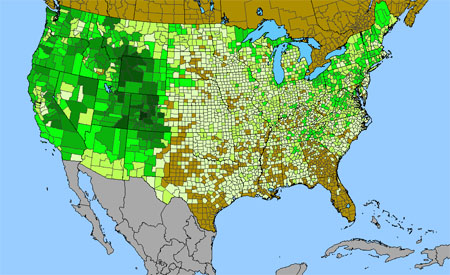 Density gradient of native species for Poa within the US (data 2011). Darkest green (18 spp. Gunnison County, CO) indicates the highest species concentration. ©BONAP | 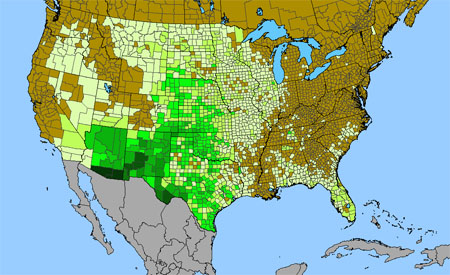 Density gradient of native species for Dalea within the US (data 2011). Darkest green (22 spp. Pima County, AZ) indicates the highest species concentration. ©BONAP |
 Density gradient of native species for Oenothera within the US (data 2011). Darkest green (17 spp. Roosevelt County, NM; Cochise County, AZ; Coconino County, AZ; Pima County, AZ) indicates the highest species concentration. ©BONAP | 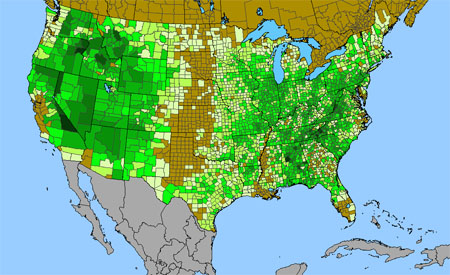 Density gradient of native species for Phlox within the US (data 2011). Darkest green (11 spp. Inyo County, CA; Tuscaloosa County, AL) indicates the highest species concentration. ©BONAP | 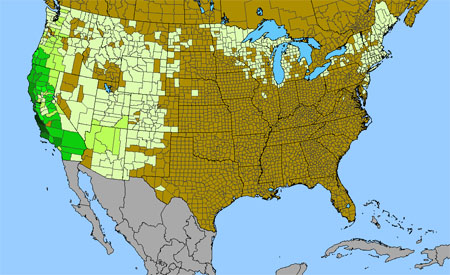 Density gradient of native species for Arctostaphylos within the US (data 2011). Darkest green (19 spp. Inyo County, CA) indicates the highest species concentration. ©BONAP |
 Density gradient of native species for Eleocharis within the US (data 2011). Darkest green (25 spp. Mobile County, AL) indicates the highest species concentration. ©BONAP | 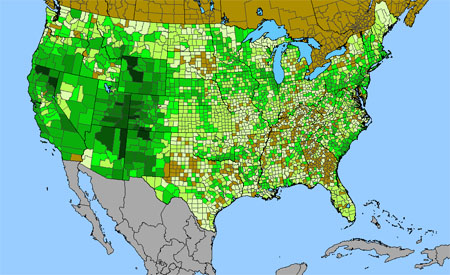 Density gradient of native species for Cirsium within the US (data 2011). Darkest green (11 spp. Apache County, AZ; Park County, WY) indicates the highest species concentration. ©BONAP | 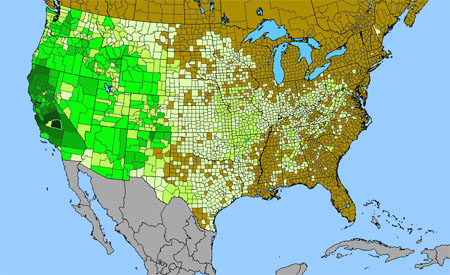 Density gradient of native species for Delphinium within the US (data 2011). Darkest green (16 spp. Tulare County, CA) indicates the highest species concentration. ©BONAP |
 Density gradient of native species for Calochortus within the US (data 2011). Darkest green (17 spp. Kern County, CA) indicates the highest species concentration. ©BONAP | 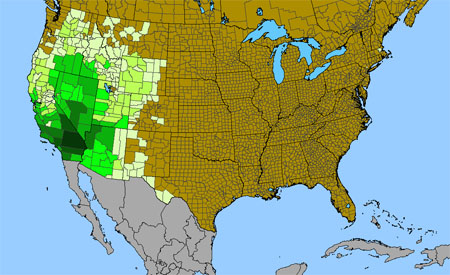 Density gradient of native species for Camissonia within the US (data 2011). Darkest green (27 spp. San Bernardino County, CA) indicates the highest species concentration. ©BONAP | 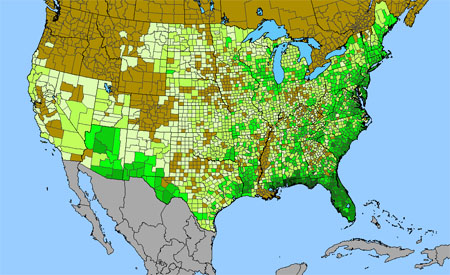 Density gradient of native species for Polygala within the US (data 2011). Darkest green (17 spp. Mobile County, AL) indicates the highest species concentration. (traditional usage) ©BONAP |
 Density gradient of native species for Silene within the US (data 2011). Darkest green (16 spp. Shasta County, CA) indicates the highest species concentration. ©BONAP | 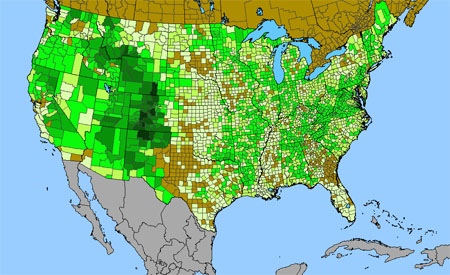 Density gradient of native species for Packera within the US (data 2011). Darkest green (13 spp. Rio Arriba County, NM) indicates the highest species concentration. ©BONAP | 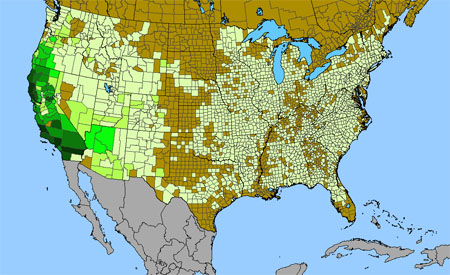 Density gradient of native species for Ceanothus within the US (data 2011). Darkest green (19 spp. Los Angeles County, CA; Mendocino County, CA) indicates the highest species concentration. ©BONAP |
 Density gradient of native species for Helianthus within the US (data 2011). Darkest green (14 spp. Cook County, CO; Richland County, SC) indicates the highest species concentration. ©BONAP | 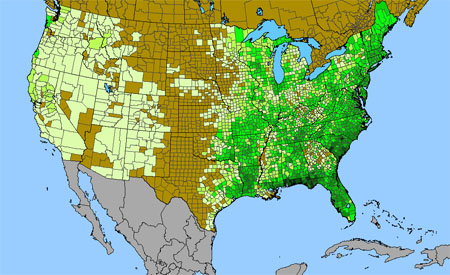 Density gradient of native species for Hypericum within the US (data 2011). Darkest green (20 spp. Franklin County, FL; Walton County, FL; Mobile County, AL) indicates the highest species concentration. ©BONAP | 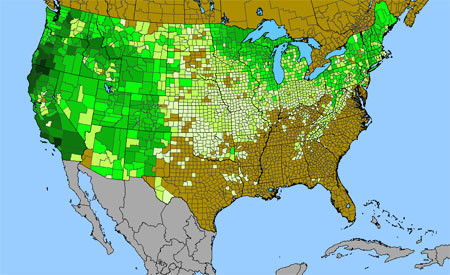 Density gradient of native species for Ribes within the US (data 2011). Darkest green (17 spp. Los Angeles County, CA) indicates the highest species concentration. ©BONAP |
 Density gradient of native species for Senecio within the US (data 2011). Darkest green (17 spp. Larimer County, CO) indicates the highest species concentration. ©BONAP | 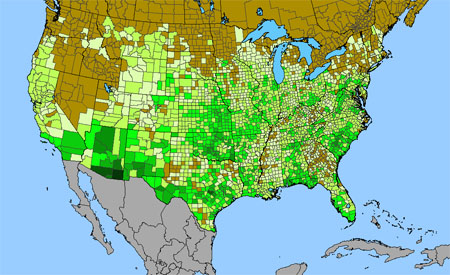 Density gradient of native species for Euphorbia within the US (data 2011). Darkest green (15 spp. Cochise County, AZ) indicates the highest species concentration. ©BONAP | 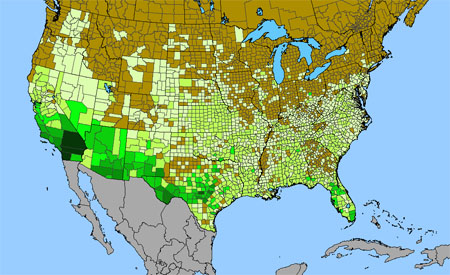 Density gradient of native species for Salvia within the US (data 2011). Darkest green (14 spp. San Diego County, CA) indicates the highest species concentration. ©BONAP |
 Density gradient of native species for Cymopterus within the US (data 2011). Darkest green (14 spp. Garfield County, UT) indicates the highest species concentration. ©BONAP | 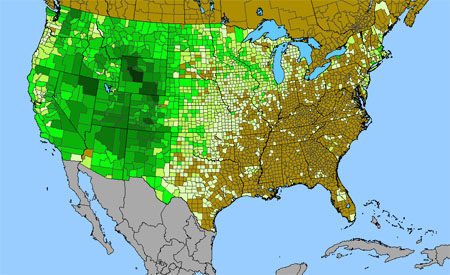 Density gradient of native species for Artemisia within the US (data 2011). Darkest green (17 spp. Fremont County, WY) indicates the highest species concentration. ©BONAP | 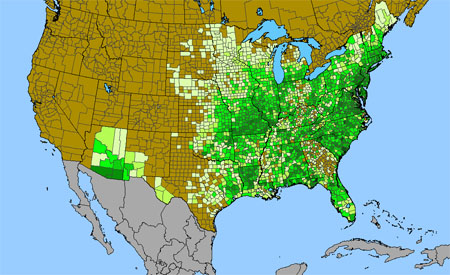 Density gradient of native species for Desmodium within the US (data 2011). Darkest green (21 spp.Leon County, FL) indicates the highest species concentration. ©BONAP |
 Density gradient of native species for Micranthes within the US (data 2011). Darkest green (12 spp. Siskiyou County, CA; Chelan County, WA; Ravalli County, MT) indicates the highest species concentration. ©BONAP | 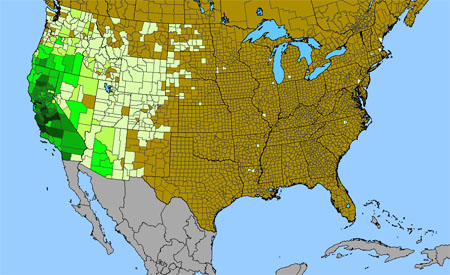 Density gradient of native species for Plagiobothrys within the US (data 2011). Darkest green (21 spp. Stanislaus County, CA) indicates the highest species concentration. ©BONAP | 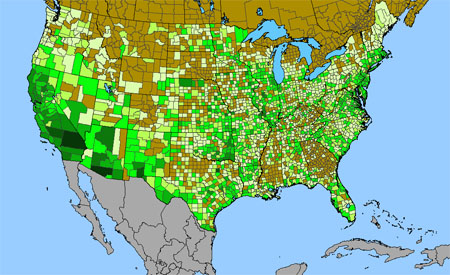 Density gradient of native species for Cuscuta within the US (data 2011). Darkest green (12 spp. Pima County, AZ) indicates the highest species concentration. ©BONAP |
 Density gradient of native species for Scutellaria within the US (data 2011). Darkest green (9 spp. Montgomery County, MD; Gallia County, OH) indicates the highest species concentration. ©BONAP | 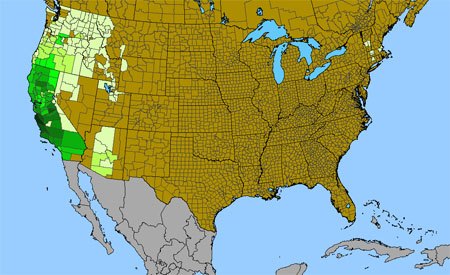 Density gradient of native species for Clarkia within the US (data 2011). Darkest green (19 spp. Monterey County, CA) indicates the highest species concentration. ©BONAP | 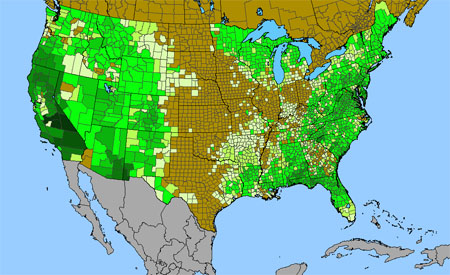 Density gradient of native species for Pinus within the US (data 2011). Darkest green (12 spp. Fresno County, CA) indicates the highest species concentration. ©BONAP |
 Density gradient of native species for Sisyrinchium within the US (data 2011). Darkest green (9 spp. Natchitoches Parish, LA) indicates the highest species concentration. ©BONAP | 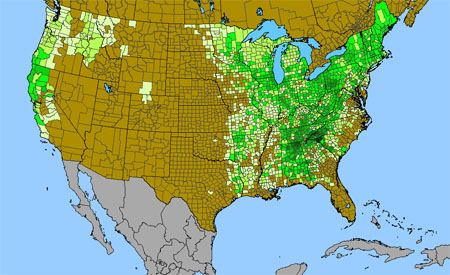 Density gradient of native species for Trillium within the US (data 2011). Darkest green (11 spp. Oconee County, SC; Polk County, TN) indicates the highest species concentration. ©BONAP | 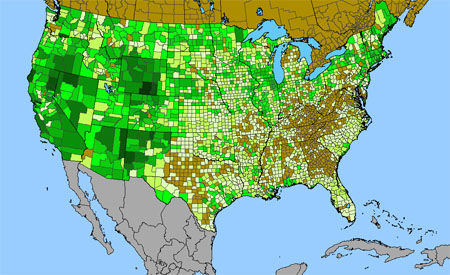 Density gradient of native species for Rumex within the US (data 2011). Darkest green (9 spp. Carbon County, WY) indicates the highest species concentration. ©BONAP |
 Density gradient of native species for Epilobium within the US (data 2011). Darkest green (19 spp. Plumas County, CA; Shasta County, CA; Siskiyou County, CA) indicates the highest species concentration. ©BONAP | 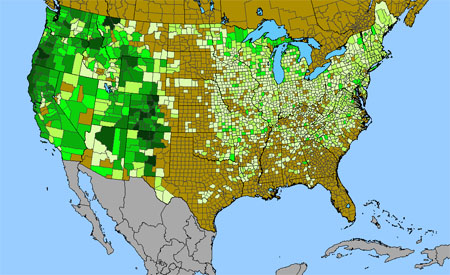 Density gradient of native species for Festuca within the US (data 2011). Darkest green (11 spp. Larimer County, CO; Flathead County, MT; Glacier County, MT) indicates the highest species concentration. ©BONAP | 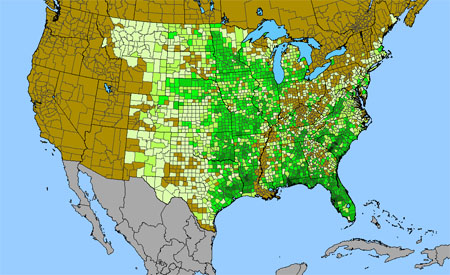 Density gradient of native species for Liatris within the US (data 2011). Darkest green (11 spp. Aiken County, SC) indicates the highest species concentration. ©BONAP |
 Density gradient of native species for Lotus within the US (data 2011). Darkest green (19 spp. Monterey County, CA)indicates the highest species concentration. ©BONAP | 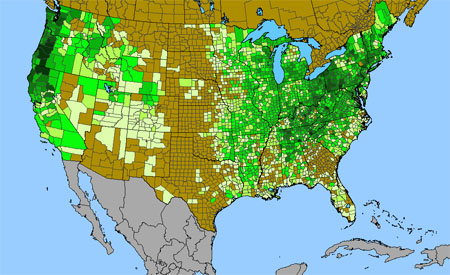 Density gradient of native species for Cardamine within the US (data 2011). Darkest green (10 spp. Madison County, KY) indicates the highest species concentration. ©BONAP | 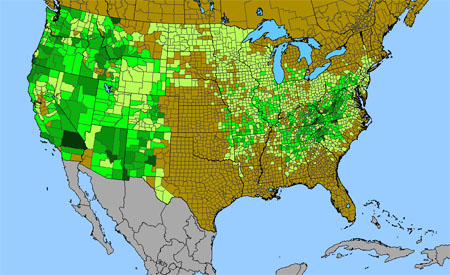 Density gradient of native species for Heuchera within the US (data 2011). Darkest green (6 spp. Stokes County, NC; Surry County, NC; San Bernardino County, CA) indicates the highest species concentration. ©BONAP |
 Density gradient of native species for Pedicularis within the US (data 2011). Darkest green (9 spp. Teton County, WY) indicates the highest species concentration. ©BONAP | 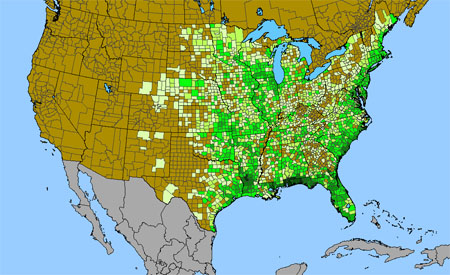 Density gradient of native species for Agalinis within the US (data 2011). Darkest green (13 spp. Franklin County, FL; Mobile County, AL) indicates the highest species concentration. ©BONAP | 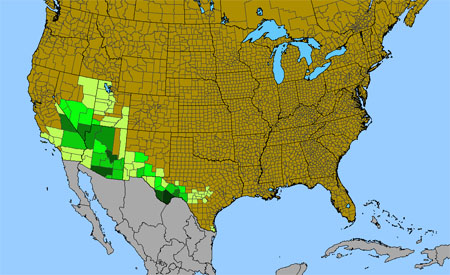 Density gradient of native species for Perityle within the US (data 2011). Darkest green (7 spp. Brewster County, TX) indicates the highest species concentration. ©BONAP |
 Density gradient of native species for Platanthera within the US (data 2011). Darkest green (14 spp. Orleans County, VT) indicates the highest species concentration. ©BONAP | 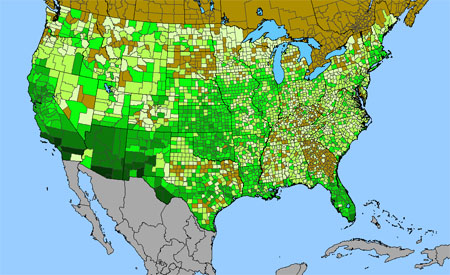 Density gradient of native species for Solanum within the US (data 2011). Darkest green (11 spp. Pima County, AZ) indicates the highest species concentration. ©BONAP | 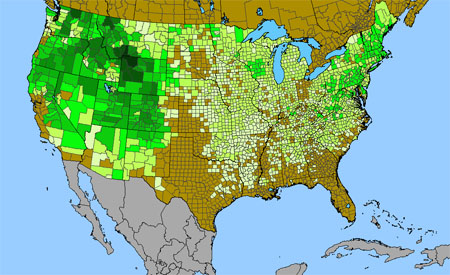 Density gradient of native species for Antennaria within the US (data 2011). Darkest green (17 spp. Park County, WY) indicates the highest species concentration. ©BONAP |
 Density gradient of native species for Ericameria within the US (data 2011). Darkest green (14 spp. Inyo County, CA; Clark County, NV) indicates the highest species concentration. ©BONAP | 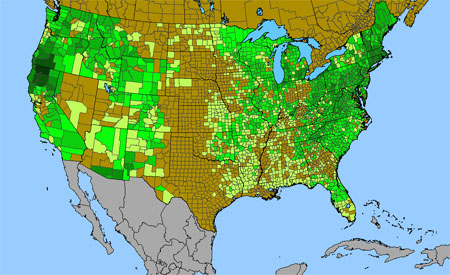 Density gradient of native species for Hieracium within the US (data 2011). Darkest green (8 spp. Siskiyou County, CA) indicates the highest species concentration. ©BONAP | 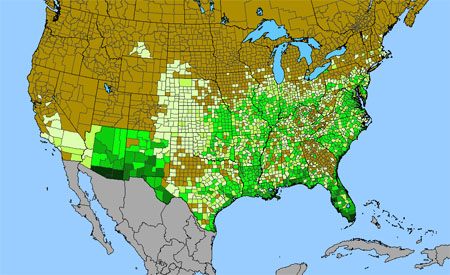 Density gradient of native species for Ipomoea within the US (data 2011). Darkest green (13 spp. Cochise County, AZ; Santa Cruz County, AZ) indicates the highest species concentration. ©BONAP |
 Density gradient of native species for Isoetes within the US (data 2011). Darkest green (6 spp. Aroostook County, ME) indicates the highest species concentration. ©BONAP | 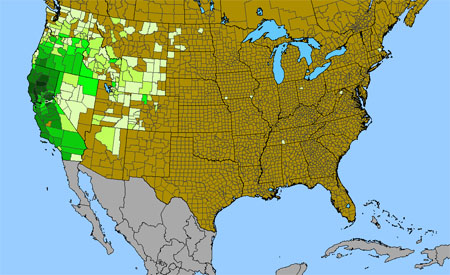 Density gradient of native species for Navarretia within the US (data 2011). Darkest green (16 spp. Lake County, CA; Napa County, CA; Amador County, CA) indicates the highest species concentration. ©BONAP | 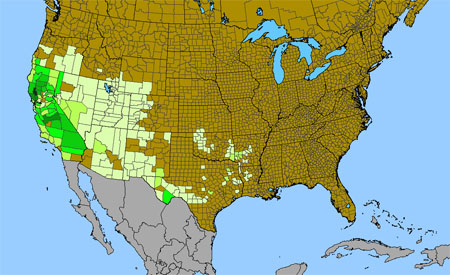 Density gradient of native species for Streptanthus within the US (data 2011). Darkest green (12 spp. Lake County, CA) indicates the highest species concentration. ©BONAP | |
 Density gradient of native species for Chorizanthe within the US (data 2011). Darkest green (20 spp. San Luis Obispo County, CA) indicates the highest species concentration. ©BONAP | 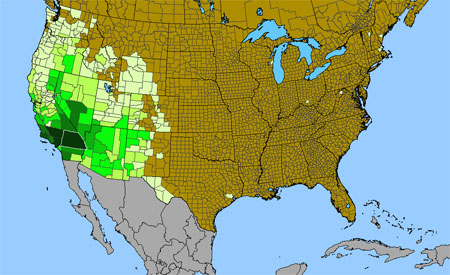 Density gradient of native species for Gilia within the US (data 2011). Darkest green (22 spp. San Bernardino County, CA)indicates the highest species concentration. ©BONAP | 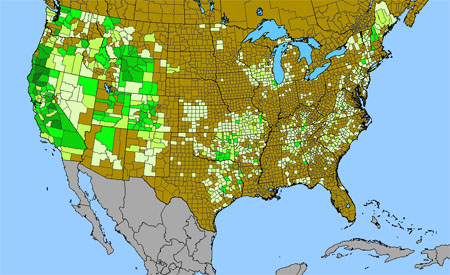 Density gradient of native species for Minuartia within the US (data 2011). Darkest green (7 spp. Trinity County, CA) indicates the highest species concentration. ©BONAP | |
 Density gradient of native species for Potamogeton within the US (data 2011). Darkest green (24 spp. Washington County, NY) indicates the highest species concentration. ©BONAP | 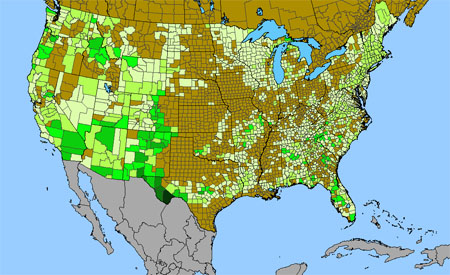 Density gradient of native species for Selaginella within the US (data 2011). Darkest green (10 spp. Brewster County, TX) indicates the highest species concentration. ©BONAP | 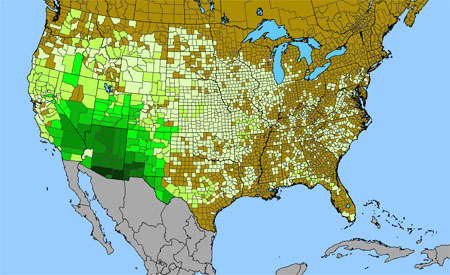 Density gradient of native species for Brickellia within the US (data 2011). Darkest green (16 spp. Cochise County, AZ) indicates the highest species concentration. ©BONAP | |
 Density gradient of native species for Coreopsis within the US (data 2011). Darkest green (11 spp. Berkeley County, SC) indicates the highest species concentration. ©BONAP | 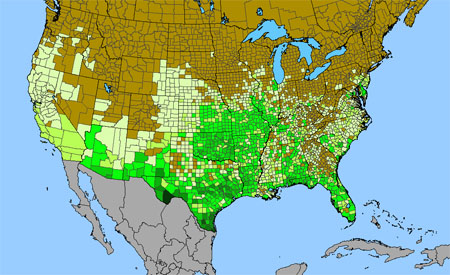 Density gradient of native species for Croton within the US (data 2011). Darkest green (12 spp. Brewster County, TX) indicates the highest species concentration. ©BONAP | 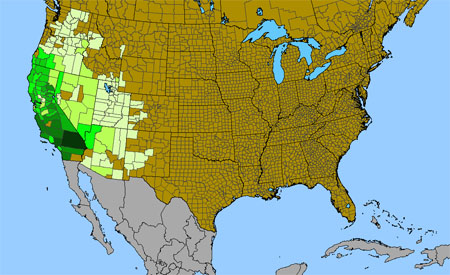 Density gradient of native species for Monardella within the US (data 2011). Darkest green (12 spp. San Bernardino County, CA) indicates the highest species concentration. ©BONAP | |
 Density gradient of native species for Paspalum within the US (data 2011). Darkest green (18 spp. Brazoria County, TX) indicates the highest species concentration. ©BONAP | 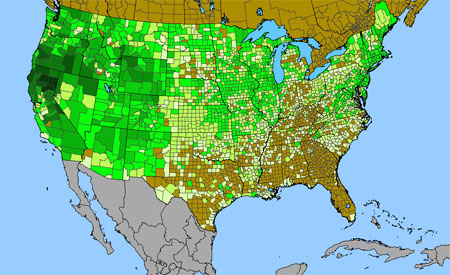 Density gradient of native species for Polygonum within the US (data 2011). Darkest green (13 spp. Plumas County, CA) indicates the highest species concentration. ©BONAP | 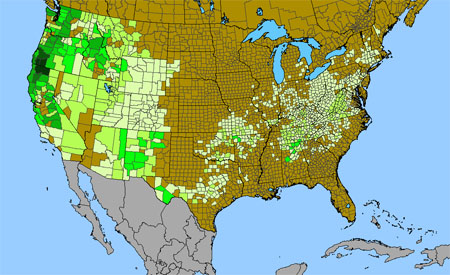 Density gradient of native species for Sedum within the US (data 2011). Darkest green (11 spp. Josephine County, OR) indicates the highest species concentration. ©BONAP | |
 Density gradient of native species for Vaccinium within the US (data 2011). Darkest green (11 spp. Hancock County, ME; Oxford County, ME; Coos County, NH; Carroll County, NH; Grafton County, NH; Chittenden County, VT; Lamoille County, VT) indicates the highest species concentration. ©BONAP | 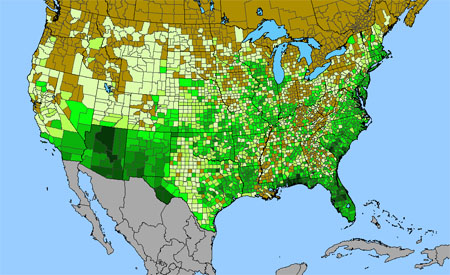 Density gradient of native species for Aristida within the US (data 2011). Darkest green (11 spp. Baldwin County, AL) indicates the highest species concentration. ©BONAP | 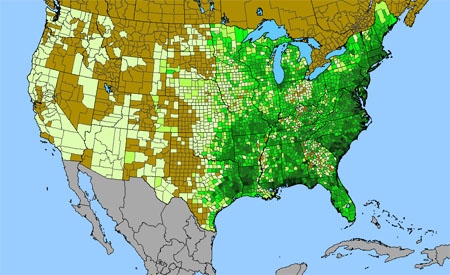 Density gradient of native species for Dichanthelium within the US (data 2011). Darkest green (19 spp. Southampton County, VA)indicates the highest species concentration. ©BONAP | |
 Density gradient of native species for Elymus within the US (data 2011). Darkest green (12 spp. Crook County, WY) indicates the highest species concentration. ©BONAP | 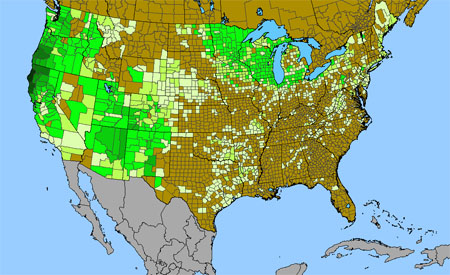 Density gradient of native species for Lathyrus within the US (data 2011). Darkest green (13 spp. Humboldt County, CA) indicates the highest species concentration. ©BONAP | 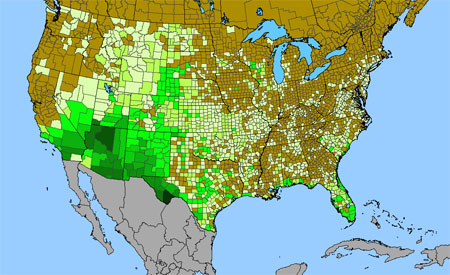 Density gradient of native species for Opuntia within the US (data 2011). Darkest green (12 spp. Brewster County, TX) indicates the highest species concentration. ©BONAP | |
| Return to top of Map View Return to Graph View |
|
| |
| | | | |
| Graphs and maps generated by David Maliken, Misako Nishino and John Kartesz. | |