
(A Data Comparison)
Although haunted by the thought of assessing 70 million or more voucher specimens and limited by financial support, BONAP's decades-long pursuit of a county-level North American Plant Atlas (NAPA) is nearing a satisfactory culmination. From the beginning, when we scribbled the first scientific name on a single 3 x 5 note card over 40 years ago, our effort to provide a truly comprehensive NAPA database has grown into a collection of over 5 million county-level records, representing 32,000 unique North American plant taxa and all 3,142 U.S. counties. Over these decades, development of various technologies has enabled us to advance these efforts and facilitated our county-level documentation, which has also been assisted enormously by the critical reviews of scores of conscientious plant systematicists and field botanists, who have carefully and enthusiastically examined our distribution records. Although peaking in growth during the mid- to late-1990s from nearly a million county-level records entered annually to a current annual rate of approximately 50,000 - 100,000 records, we anticipate that the NAPA will continue to expand at this rate, and our existing maps will need to be modified to reflect many of the remaining 250,000 to 300,000 unreported county-level records now housed within our North American repositories. This task will pale by comparison when we attempt to locate and document the anticipated 1.5 - 2 million additional county records of taxa that remain undiscovered on our North American landscapes.
In the 1980s and early 1990s, two decades after the initiation of the NAPA, BONAP had assembled nearly 1.8 million county-level records. At that time, we began sharing our taxonomic and phytogeographic data with other institutions and organizations, including various U.S. government agencies, such as the U.S. Department of Agriculture's (USDA) Animal and Plant Health Inspection Service (APHIS) and U.S. Forest Service (USFS), the U.S. Department of the Interior's Bureau of Reclamation (USBR), Bureau of Land Management (BLM) and National Park Service (NPS), and the USDA Natural Resources Conservation Service (NRCS), then known as the U.S. Soil Conservation Service (SCS). Over the next decade and a half, BONAP became far more assertive by providing under various contracts, our taxonomic and phytogeographic data to specific Federal agencies, such as the USDA-NRCS. During that time BONAP's data began serving as the taxonomic backbone and phytogeography framework for the current version of USDA-PLANTS Database.
Over these four decades, the NAPA has grown exponentially. To illustrate the expansion, we have provided the above map to reflect the percentage increase of species-level occurrences within each of our U.S. counties. The current county-level data of the USDA-PLANTS Database (which are nearly the same as our original county-level data provided to them almost 20 years ago) were compared with the current county-level data of BONAP's NAPA. This map shows the average percentage of species-level occurrences not reported by PLANTS to be approximately 35% for each U.S. county. For some counties, e.g., those in eastern Iowa and central and southern Alabama, the data reflect a much greater increase (in some cases, by 90%). Areas showing the greatest overall percentage increase of species per county are those in eastern Iowa, western Montana, southwestern Georgia, central Texas, southwestern Nebraska, most of northern and northwestern South Carolina, and most of Oklahoma, New Mexico and Alabama. Since BONAP never provided county-level data for Maryland to the USDA-NRCS, all its counties show an increase of 100%. Interestingly, two states, Missouri and Texas, show a few counties with greater than 100% and others approximating 100% increase. This is due primarily to an internal data-transcription error within the original BONAP data submitted to USDA's PLANTS, which was apparently never corrected by the USDA-NRCS personnel. Countless other county-level records provided to USDA's PLANTS by BONAP over the decades have been shown with further research and new data to be in error, but remain unchanged within the PLANTS Database. BONAP maintains a separate "false reports" database for those records now known to be incorrect due to misidentifications, changes in species circumscriptions, inaccuracies in site location points, etc. Once determined to be incorrect, we remove that record from our master database and place it within our false reports database. Over the decades, that database alone has grown to nearly 130,000 county-level records.
Many factors have contributed to the large percentage increase of species within our counties. In nearly half of our states, including Alabama, Alaska, Arizona, California, Colorado, Florida, Hawaii, Idaho, Illinois, Kansas, Kentucky, Louisiana, Michigan, Minnesota, Nebraska, New Mexico, New York, Oklahoma, Oregon, Pennsylvania, South Carolina, Tennessee, Texas, Utah, Virginia, Washington, West Virginia and Wisconsin, a large number of herbaria and museum collections have been digitized over the decades, adding many county records to BONAP's NAPA. Currently, digitization of other institutional collections are underway, such as those from Georgia, Iowa, North Carolina, Ohio and South Dakota, and their county-level records thus far have in part or in total been added to NAPA. Moreover, vast numbers of new county collections based on field work have been added to states such as Alabama, Arizona, Colorado, Delaware, Iowa, Minnesota, Montana, New Mexico, North Carolina, Pennsylvania, Utah and Wyoming (including many of my own). Also adding to the increased number of county-level records is the significant number of recently published county-level plant atlases and floras, e.g., the Flora of Nebraska (by R.B. Kaul, D.M. Sutherland and S.B. Rolfsmeier); the Atlas of the Flora of New England (by R. Angelo and D.E. Boufford; available on the Internet); Checklist and Atlas of the Vascular Flora of West Virginia (edited by P.J. Harmon, D. Ford-Werntz and W. Grafton); The Flora of Delaware: An Annotated Checklist (by W.A. McAvoy and K.A. Bennett); Atlas of Tennessee Vascular Plants (by E.W. Chester, B.E. Wofford, R. Kral, H.R. DeSelm and A.M. Evans); Atlas of the Vascular Plants of Texas (by B.L. Turner, H. Nichols, G. Denny and O. Doron); and Vascular Plants of the Greater Yellowstone Area: Annotated Catalog and Atlas (by E.F. Evert). Other states, e.g., Arkansas and Kentucky, are currently developing plant atlases. Adding to the total tally of new county-level records are countless journal articles and other scientific publications. From the 1940s to the present, these sources alone account for nearly 100,000 U.S. county records, many of which are undocumented elsewhere. With all of this activity and effort, it is understandable that the above map reflects a large increase in the percentage of species per county.
BONAP plans to update the NAPA semi-annually (July and January). Each update will present the number of new species-level occurrence for each U.S. county. By July 1, 2011, we plan to add approximately 30,000 more county-level records to the NAPA.
Comments for adding or deleting records are always welcomed.
We are very grateful to the USDA-NRCS for their past support and for providing information for this data comparison. -JTK
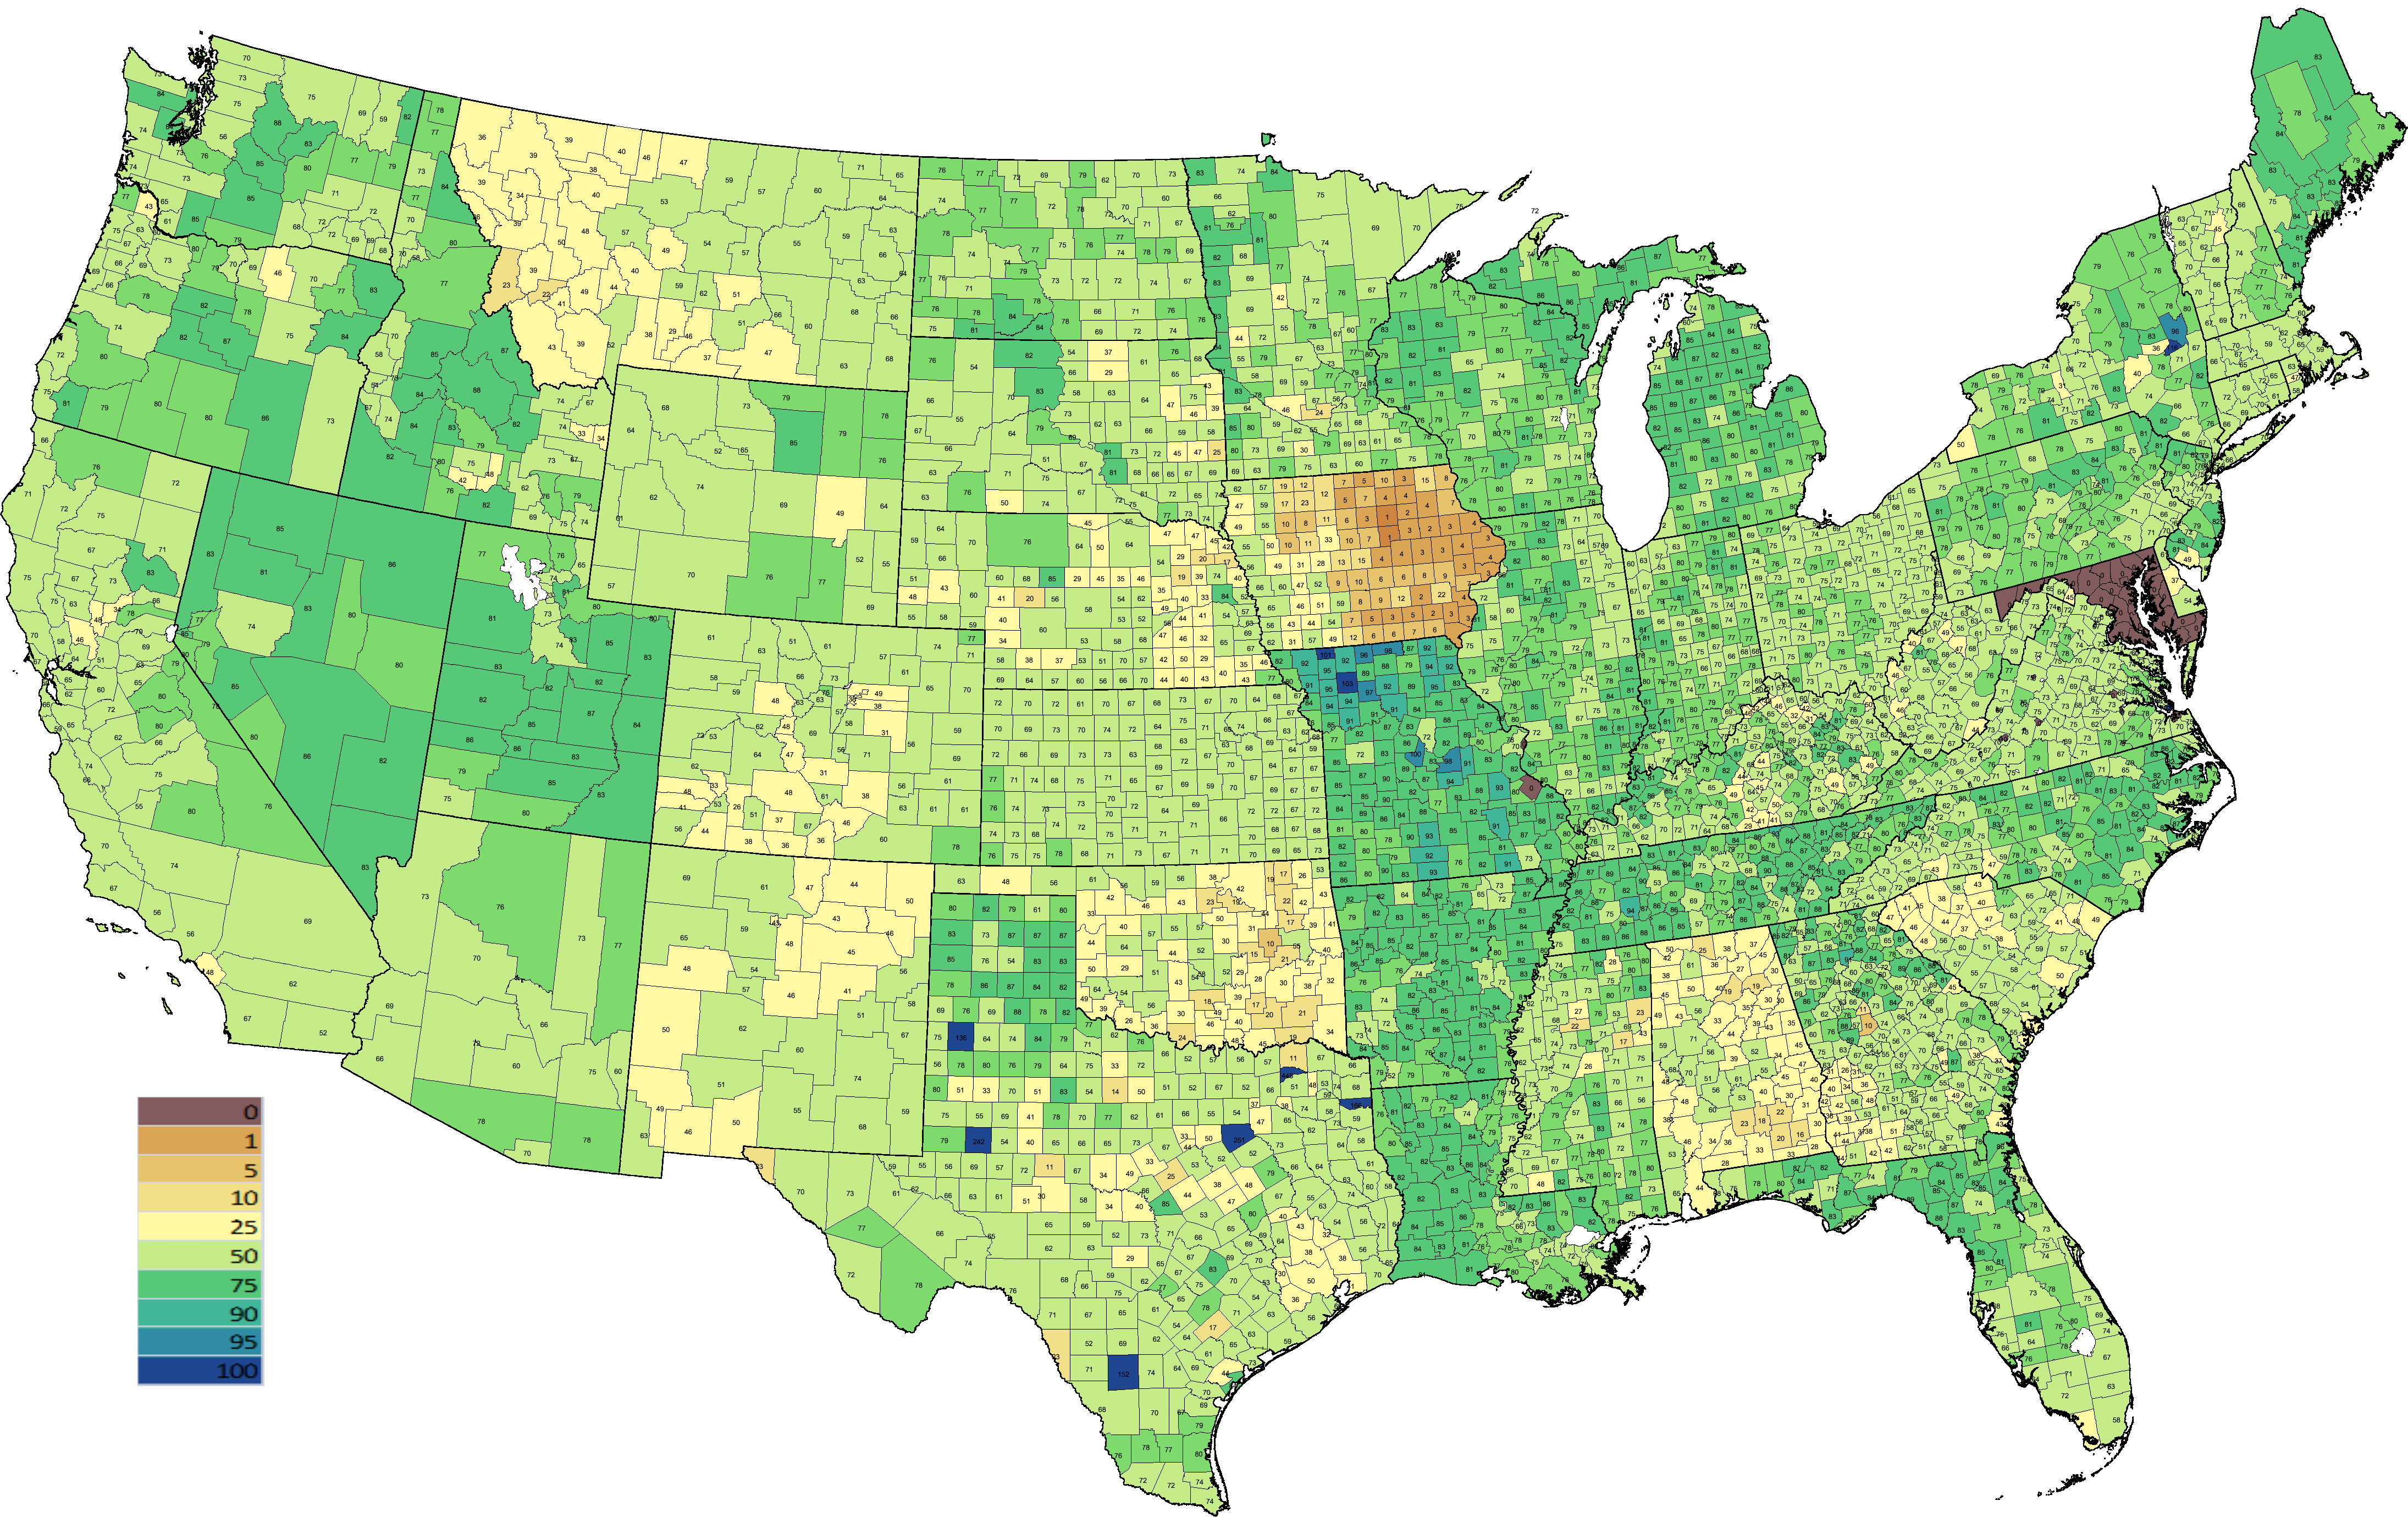
Species-level occurrence data comparison between the NRCS-PLANTS Database and that of BONAP's NAPA.
Last updated May 4, 2015.